
Introduction
This guide provides a comprehensive overview of various health checks that can be performed to assess the functionality and stability of your platform. These checks should be performed after a platform upgrade to ensure that everything works correctly and that no new issues have been introduced.
Health Checks
Some of these health checks rely on the use of the sre-admin tool, while others depend on OS commands or subsystem monitoring commands.
TIP
On some systems, the sre-admin tool may complain about the locales not being correctly set at the OS level. If this occurs, you can set it to a default locale with the following command: export LC_ALL=en_US.utf8.
Global Status
Target servers: master EM
The sre-admin tool can be used to check the global status of the system with /opt/sre/bin/sre-admin status. This command provides status about various information collected from all the EMs and CPs, including:
- DB status
- DB replication status
- active connections on local DB
- SRE processes status
- CPU and RAM usage
Example:
[root@sre-41-em2 ~]# /opt/sre/bin/sre-admin status
Server DB status
Hostname    Status
----------  --------
sre-41-em2  master

Server DB replication status
Client     Address       State      Started    WAL sent     WAL written    WAL flushed    WAL replayed
---------  ------------  ---------  ---------  -----------  -------------  -------------  --------------
sre41-cp1  10.0.161.198  streaming  08:35:58   12/523C5F40  12/523C5F40    12/523C5F40    12/523C5F40
sre41-cp2  10.0.161.199  streaming  08:35:59   12/523C5F40  12/523C5F40    12/523C5F40    12/523C5F40
sre41-em1  10.0.161.196  streaming  21:19:16   12/523C5F40  12/523C5F40    12/523C5F40    12/523C5F40

Server DB activity
Client     Address       Username        PID  DB                   Last state change      State    Query
---------  ------------  ----------  -------  -------------------  ---------------------  -------  -------------------------------------------------------------------------------------------------------------------------------------------
                                        1644
                         postgres       1647
           127.0.0.1     sre         2136603  sre                  10:40:49 (2.20)        idle     COMMIT
           127.0.0.1     sre         2140354  sre                  10:40:50 (0.85)        idle     ROLLBACK
           127.0.0.1     sre         2140529  sre                  10:40:51 (0.14)        idle     ROLLBACK
           127.0.0.1     sre         2140359  sre                  10:40:50 (0.86)        idle     ROLLBACK
           127.0.0.1     sre         2140562  sre                  10:39:58 (52.67)       idle     ROLLBACK
repmgr     10.0.161.198  repmgr         1705  repmgr               10:40:43 (7.92)        idle     SELECT pg_catalog.pg_is_in_recovery()
           127.0.0.1     sre         2140567  rviltestbool_a       10:39:57 (54.26)       idle     ROLLBACK
sre41-cp1  10.0.161.198  repmgr         1667                       08:35:58 (2513092.59)  active   START_REPLICATION 11/EE000000 TIMELINE 19
sre41-cp2  10.0.161.199  repmgr         1670                       08:35:59 (2513092.20)  active   START_REPLICATION 11/EE000000 TIMELINE 19
sre41-em1  10.0.161.196  repmgr      2129380                       21:19:17 (1430494.42)  active   START_REPLICATION 12/1A000000 TIMELINE 19
...
           127.0.0.1     sre         2148412  rviltestbool_a       10:40:31 (20.08)       idle     ROLLBACK
           127.0.0.1     sre         2155173  sre                  10:40:51 (0.01)        active   SELECT datname,pid,usename,application_name,client_addr,backend_start,xact_start,query_start,state_change,state,query FROM pg_stat_activity
           127.0.0.1     sre         2140592  rben_a               10:39:57 (54.00)       idle     ROLLBACK
           127.0.0.1     sre         2148444  vodacom_a            10:39:29 (82.07)       idle     ROLLBACK
           127.0.0.1     sre         2148449  fr_stis_a            10:40:31 (19.85)       idle     ROLLBACK
           127.0.0.1     sre         2148472  sre_as_as_a          10:40:31 (19.75)       idle     ROLLBACK
                                        1642

Platform process status
Process/Server           sre-41-cp1                                       sre-41-cp2                                   sre-41-em1                                     sre-41-em2
-----------------------  -----------------------------------------------  -------------------------------------------  ---------------------------------------------  -------------------------------------------
sre-REST                 STOPPED                                          STOPPED                                      RUNNING (pid 583015, uptime 8 days, 19:37:56)  RUNNING (pid 1579, uptime 29 days, 2:05:17)
sre-agents-monitor       RUNNING (pid 3501314, uptime 32 days, 19:16:56)  RUNNING (pid 1692, uptime 29 days, 2:05:15)  STOPPED                                        STOPPED
sre-broker               RUNNING (pid 3501315, uptime 32 days, 19:16:56)  RUNNING (pid 2146, uptime 29 days, 2:05:04)  STOPPED                                        STOPPED
sre-call-processor:0     RUNNING (pid 99884, uptime 4 days, 20:33:27)                                                  STOPPED                                        STOPPED
sre-call-processor:1                                                      RUNNING (pid 1694, uptime 29 days, 2:05:15)
sre-call-processor:2                                                      RUNNING (pid 1695, uptime 29 days, 2:05:15)
sre-call-processor:3                                                      RUNNING (pid 1696, uptime 29 days, 2:05:15)
sre-call-processor:4                                                      RUNNING (pid 1697, uptime 29 days, 2:05:15)
sre-cdr-collector        STOPPED                                          STOPPED                                      RUNNING (pid 583016, uptime 8 days, 19:37:56)  RUNNING (pid 1580, uptime 29 days, 2:05:17)
sre-cdr-postprocessor    STOPPED                                          STOPPED                                      STOPPED                                        STOPPED
sre-cdr-sender           RUNNING (pid 3501317, uptime 32 days, 19:16:56)  RUNNING (pid 1698, uptime 29 days, 2:05:15)  STOPPED                                        STOPPED
sre-dns-updater          STOPPED                                          STOPPED                                      STOPPED                                        STOPPED
sre-enum-processor       STOPPED                                          STOPPED                                      STOPPED                                        STOPPED
sre-gui                  STOPPED                                          STOPPED                                      RUNNING (pid 583017, uptime 8 days, 19:37:56)  RUNNING (pid 1581, uptime 29 days, 2:05:17)
sre-health-monitor       RUNNING (pid 3501318, uptime 32 days, 19:16:56)  RUNNING (pid 1699, uptime 29 days, 2:05:15)  RUNNING (pid 583018, uptime 8 days, 19:37:56)  RUNNING (pid 1582, uptime 29 days, 2:05:17)
sre-http-processor       RUNNING (pid 3501319, uptime 32 days, 19:16:56)  STOPPED                                      STOPPED                                        STOPPED
sre-manager              STOPPED                                          STOPPED                                      RUNNING (pid 3498851, uptime 10:40:49)         RUNNING (pid 1928631, uptime 10:40:50)
sre-media-processor      RUNNING (pid 1161457, uptime 1 day, 0:50:10)     RUNNING (pid 1700, uptime 29 days, 2:05:15)
sre-remote-registration  STOPPED                                          STOPPED                                      STOPPED                                        STOPPED
sre-scheduler            RUNNING (pid 3501321, uptime 32 days, 19:16:56)  RUNNING (pid 1701, uptime 29 days, 2:05:15)  RUNNING (pid 583020, uptime 8 days, 19:37:56)  RUNNING (pid 1585, uptime 29 days, 2:05:17)
telegraf                 RUNNING (pid 3501322, uptime 32 days, 19:16:56)  RUNNING (pid 1702, uptime 29 days, 2:05:15)  RUNNING (pid 583021, uptime 8 days, 19:37:56)  RUNNING (pid 1586, uptime 29 days, 2:05:17)

Platform system status
Metric/Server    sre-41-cp1    sre-41-cp2    sre-41-em1    sre-41-em2
---------------  ------------  ------------  ------------  ------------
CPU              9.8 %         4.7 %         4.3 %         34.2 %
Memory           60.9 %        67.8 %        58.0 %        38.6 %
Swap             15.2 %        17.8 %        13.9 %        1.2 %
SRE Process
Target servers: EMs and CPs
You may check that the SRE processes are running by executing the systemctl status sre command.
Example:
[root@sre-41-em2 ~]# systemctl status sre
● sre.service - SRE is a centralized, multi interface Session Routing Engine.
   Loaded: loaded (/usr/lib/systemd/system/sre.service; enabled; vendor preset: disabled)
   Active: active (running) since Tue 2026-06-09 08:35:19 CEST; 4 weeks 1 days ago
     Docs: https://www.netaxis.be/products/session-routing-engine/
 Main PID: 821 (supervisord)
    Tasks: 142 (limit: 48944)
   Memory: 1.3G
   CGroup: /system.slice/sre.service
           ├─    821 /opt/sre/bin/python /opt/sre/bin/supervisord -n
           ├─   1579 /opt/sre/bin/python /opt/sre/bin/sre-REST
           ├─   1580 /opt/sre/bin/python /opt/sre/bin/sre-cdr-collector
           ├─   1581 /opt/sre/bin/python /opt/sre/bin/sre-gui
           ├─   1582 /opt/sre/bin/python /opt/sre/bin/sre-health-monitor
           ├─   1585 /opt/sre/bin/python /opt/sre/bin/sre-scheduler
           ├─   1586 telegraf --config /opt/sre/etc/telegraf.conf
           └─1928631 /opt/sre/bin/python /opt/sre/bin/sre-manager
Process Monitoring
Target servers: EMs and CPs
On a typical deployment, the processes to check are respectively:
- Element Manager:
- sre-REST (if API are used)
- sre-gui
- sre-manager
- sre-cdr-collector
- sre-health-monitor
- sre-scheduler
- Call Processor:
- sre-agents-monitor
- sre-broker
- sre-call-processor: [0-n] (the number will depend on the supervisor configuration file)
- sre-health-monitor
- sre-cdr-sender
- sre-scheduler
The operational status of processes running on SRE can be monitored by using the ps command and “grepping” on the process name. All SRE processes start with the string /opt/sre/bin/ python /opt/sre/bin/sre-
Example:
[root@sre-41-em2 ~]# ps -ef | grep "opt/sre/bin/python /opt/sre/bin/sre-" | grep -v grep
sre         1579     821  5 Jun09 ?        1-13:57:48 /opt/sre/bin/python /opt/sre/bin/sre-REST
sre         1580     821  1 Jun09 ?        09:28:12 /opt/sre/bin/python /opt/sre/bin/sre-cdr-collector
sre         1581     821  0 Jun09 ?        02:28:08 /opt/sre/bin/python /opt/sre/bin/sre-gui
sre         1582     821  3 Jun09 ?        1-02:22:29 /opt/sre/bin/python /opt/sre/bin/sre-health-monitor
root        1585     821  0 Jun09 ?        00:18:43 /opt/sre/bin/python /opt/sre/bin/sre-scheduler
sre      1928631     821 14 00:00 ?        01:33:15 /opt/sre/bin/python /opt/sre/bin/sre-manager
[root@sre-41-cp2 ~]# ps -ef | grep "opt/sre/bin/python /opt/sre/bin/sre-" | grep -v grep
sre 1692 822 2 Jun09 ? 14:29:59 /opt/sre/bin/python /opt/sre/bin/sre-agents-monitor
sre 1694 822 0 Jun09 ? 05:48:51 /opt/sre/bin/python /opt/sre/bin/sre-call-processor 1
sre 1695 822 0 Jun09 ? 05:52:16 /opt/sre/bin/python /opt/sre/bin/sre-call-processor 2
sre 1696 822 0 Jun09 ? 05:52:09 /opt/sre/bin/python /opt/sre/bin/sre-call-processor 3
sre 1697 822 0 Jun09 ? 05:51:18 /opt/sre/bin/python /opt/sre/bin/sre-call-processor 4
sre 1698 822 0 Jun09 ? 00:52:07 /opt/sre/bin/python /opt/sre/bin/sre-cdr-sender
sre 1699 822 4 Jun09 ? 1-04:49:33 /opt/sre/bin/python /opt/sre/bin/sre-health-monitor
root 1700 822 0 Jun09 ? 04:27:32 /opt/sre/bin/python /opt/sre/bin/sre-media-processor
root 1701 822 0 Jun09 ? 02:48:50 /opt/sre/bin/python /opt/sre/bin/sre-schedulerThe administrative status of the processes can be monitored with the supervisorctl tool
Example:
[root@sre-41-em2 ~]# supervisorctl
sre-REST                         RUNNING   pid 1579, uptime 29 days, 2:27:08
sre-agents-monitor               STOPPED   Not started
sre-broker                       STOPPED   Not started
sre-call-processor:0             STOPPED   Not started
sre-cdr-collector                RUNNING   pid 1580, uptime 29 days, 2:27:08
sre-cdr-postprocessor            STOPPED   Not started
sre-cdr-sender                   STOPPED   Not started
sre-dns-updater                  STOPPED   Not started
sre-enum-processor               STOPPED   Not started
sre-gui                          RUNNING   pid 1581, uptime 29 days, 2:27:08
sre-health-monitor               RUNNING   pid 1582, uptime 29 days, 2:27:08
sre-http-processor               STOPPED   Not started
sre-manager                      RUNNING   pid 1928631, uptime 11:02:41
sre-remote-registration          STOPPED   Not started
sre-scheduler                    RUNNING   pid 1585, uptime 29 days, 2:27:08
telegraf                         RUNNING   pid 1586, uptime 29 days, 2:27:08
Process Management
All SRE processes are managed by supervisord. Once connected to supervisord, several commands are available, as shown with the help command.
Example:
supervisor> help
default commands (type help <topic>):
=====================================
add    exit      open  reload  restart   start   tail
avail  fg        pid   remove  shutdown  status  update
clear  maintail  quit  reread  signal    stop    version
On start, supervisord reads its configuration file (/opt/sre/etc/supervisord-program.conf) to select which programs must be started. It is possible to overrule this configuration by manually starting or stopping processes.
A single process can be restarted with the restart <program> command.
Example:
supervisor> restart sre-manager
sre-manager: stopped
sre-manager: started
A single process can be stopped with the stop <program> command.
Example:
supervisor> stop sre-manager
sre-manager: stopped
A single process can be started with the start <program> command.
Example:
supervisor> start sre-manager
sre-manager: started
The supervisord configuration can be reloaded with the reload command. This operation stops all the processes and they are restarted according to the supervisord configuration file. In particular, if a process has been manually started while it is not active in the configuration, this process will not start after the reload operation.
Example:
supervisor> reload
Really restart the remote supervisord process y/N? y
Restarted supervisord
It is possible to read what a process outputs on its standard output with the tail <program> command command.
Example:
supervisor> tail sre-managerStatistics Monitoring
Target servers: master EM
The sre-manager process writes the statistics collected from different nodes to CSV files every minute. Check the content of the CSV file /var/log/sre/counters.csv to ensure that calls are being processed and statistics are being generated. The format of this file is:
- hostname
- metric name
- timestamp (human-readable format)
- timestamp (EPOCH timestamp)
- 15 fields with the metric value, one per minute, from the most recent to the oldest
For an SRE with active traffic, the metric request.INVITE should indicate the presence of calls being processed. The presence of response.relay metrics indicate that calls have bee relayed by the Service Logic.
Example:
[root@sre-41-em2 ~]# cat /var/log/sre/counters.csv
sre-41-cp1,request.INVITE,2024-06-20T10:39:00,1718879940,16,20,23,19,18,20,24,23,21,21,26,24,21,21,19
sre-41-cp2,request.INVITE,2024-06-20T10:39:00,1718879940,0,0,1,0,0,0,0,0,0,0,1,0,0,0,0
sre-41-cp1,request.OPTIONS,2024-06-20T10:39:00,1718879940,7,6,6,6,6,6,7,7,7,5,6,7,6,7,7
sre-41-cp1,request.REGISTER,2024-06-20T10:39:00,1718879940,2,1,1,3,0,5,0,1,0,3,2,0,1,3,2
sre-41-cp1,response.200 (OPTIONS),2024-06-20T10:39:00,1718879940,7,6,6,6,6,6,7,7,7,5,6,7,6,7,7
sre-41-cp1,response.authenticate,2024-06-20T10:39:00,1718879940,5,2,1,2,1,5,2,1,1,2,2,0,2,2,1
sre-41-cp1,response.locationServiceRelay,2024-06-20T10:39:00,1718879940,1,2,0,0,1,0,2,1,0,0,0,1,0,2,2
sre-41-cp1,response.locationServiceSave,2024-06-20T10:39:00,1718879940,2,1,1,1,0,3,0,1,0,2,1,0,1,1,1
sre-41-cp1,response.proxySIPError,2024-06-20T10:39:00,1718879940,0,0,0,0,0,0,0,0,0,0,0,1,0,0,0
sre-41-cp1,response.relay,2024-06-20T10:39:00,1718879940,15,19,23,19,17,20,22,23,21,21,26,22,20,19,16
sre-41-cp2,response.relay,2024-06-20T10:39:00,1718879940,0,0,1,0,0,0,0,0,0,0,1,0,0,0,0
Particular attention should be paid to SIP request and response counters such as:
| Counter name | Description |
|---|---|
| request.INVITE | INVITE requests |
| request.OPTIONS | OPTIONS requests |
| response.redirect | Redirect responses (301) |
| response.loop | Loop reponses (482) |
| response.serviceLogicError | Service Logic Error responses (604) |
| response.serviceDown | Service Down responses (503) |
| response.genericError | Generic Error responses (500) |
| ... | ... |
Cumulative time of the duration of events and the number of such occurrences are stored in the samples.csv file. Check the content of the CSV file /var/log/sre/samples.csv to ensure that event statistics are being generated. Each record is composed of the fields:
- hostname: node which generated the event
- metric name
- timestamp (human-readable format)
- timestamp (EPOCH timestamp)
- occurrences: total number of occurrences of this event type during this window of 1 minute.
Example:
[root@sre-41-cp2 ~]# cat /var/log/sre/samples.csv
sre-40-cp1,accounting.openCalls,2023-11-08T13:18:00,1699449480,0.0,0.0,0.0,0.0,0.0,0.0,0.0,0.0,0.0,0.0,0.0,0.0,0.0,0.0,0.0
sre-40-cp1,profiling.cp.OPTIONS,2023-11-08T13:18:00,1699449480,0.003,0.002,0.002,0.002,0.002,0.002,0.003,0.003,0.003,0.001,0.002,0.003,0.003,0.003,0.005
sre-40-cp2,profiling.cp.OPTIONS,2023-11-08T13:18:00,1699449480,0.002,0.002,0.002,0.01,0.012,0.009,0.008,0.003,0.002,0.01,0.004,0.007,0.002,0.005,0.002
Samples of interest are described in the following table.
| Counter name | Description |
|---|---|
| profiling.cp.INVITE | Duration to process INVITE requests |
| profiling.cp.OPTIONS | Duration to process OPTIONS requests |
| profiling.cp.loop | Duration to perform loop detection |
| ... | ... |
Database Process
Target servers: EMs and CPs
You may check that the Database processes are running by executing the systemctl status postgresql-14 command.
Example:
[root@sre-41-em2 ~]# systemctl status postgresql-14
● postgresql-14.service - PostgreSQL 14 database server
   Loaded: loaded (/usr/lib/systemd/system/postgresql-14.service; enabled; vend>
   Active: active (running) since Tue 2026-06-09 08:35:55 CEST; 3 weeks 6 days >
     Docs: https://www.postgresql.org/docs/14/static/
  Process: 861 ExecStartPre=/usr/pgsql-14/bin/postgresql-14-check-db-dir ${PGDA>
 Main PID: 896 (postmaster)
    Tasks: 199 (limit: 48944)
   Memory: 3.2G
   CGroup: /system.slice/postgresql-14.service
           ├─    896 /usr/pgsql-14/bin/postmaster -D /var/lib/pgsql/14/data/
           ├─   1109 postgres: logger
           ├─   1641 postgres: checkpointer
           ├─   1642 postgres: background writer
           ├─   1643 postgres: walwriter
           ├─   1644 postgres: autovacuum launcher
           ├─   1645 postgres: archiver last was 00000013000000120000004B
           ├─   1646 postgres: stats collector
           ├─   1647 postgres: logical replication launcher
           ├─   1667 postgres: walsender repmgr 10.0.161.198(35286) streaming 1>
           ├─   1670 postgres: walsender repmgr 10.0.161.199(57160) streaming 1>
           ├─   1705 postgres: repmgr repmgr 10.0.161.198(42152) idle
           ├─   1713 postgres: repmgr repmgr 10.0.161.196(54670) idle
           ├─   1717 postgres: sre sre 127.0.0.1(58572) idle
           ├─1227571 postgres: sre sre 127.0.0.1(44170) idle
INFO
The number of running processes for the database can fluctuate. For instance, processes managing connections to specific databases may only appear after a call processor has received some requests.
TIP
The presence of the walsender process indicates that this instance is sending replication information to a standby DB, along with its IP address. On a standby DB instance, the presence of the process walreceiver indicates the receiving process side.
The number of running processes for the database can fluctuate. For instance, processes managing connections to specific databases may only appear after a call processor has received some requests.
The number of open connections from the sre user should remain stable. If the number of connections increase, this might be an indication that the sessions are not correctly ended .
Example:
[root@sre-41-cp2 ~]# ps -ef|grep "postgres: sre"|grep -v grep
postgres    2322     930  0 Jun09 ?        00:14:32 postgres: sre sre 127.0.0.1(51160) idle
postgres 1187811     930  0 Jun10 ?        00:00:02 postgres: sre sre 127.0.0.1(60734) idle
postgres 1187812     930  0 Jun10 ?        00:00:00 postgres: sre mydb_a 127.0.0.1(60744) idle
postgres 1187813     930  0 Jun10 ?        00:00:00 postgres: sre mydb_b 127.0.0.1(60758) idle
postgres 1187814     930  0 Jun10 ?        00:00:00 postgres: sre antiscam_a 127.0.0.1(60762) idle
postgres 1187816     930  0 Jun10 ?        00:00:00 postgres: sre antiscam_b 127.0.0.1(60768) idle
postgres 1187818     930  0 Jun10 ?        00:00:00 postgres: sre demotucana_a 127.0.0.1(60774) idle
postgres 1187821     930  0 Jun10 ?        00:00:00 postgres: sre demotucana_b 127.0.0.1(60776) idle
postgres 1187823     930  0 Jun10 ?        00:00:00 postgres: sre demo1405_a 127.0.0.1(60780) idle
postgres 1187824     930  0 Jun10 ?        00:00:00 postgres: sre demo1405_b 127.0.0.1(60790) idle
postgres 1187828     930  0 Jun10 ?        00:00:00 postgres: sre rviltestbool_a 127.0.0.1(60804) idle
postgres 1187829     930  0 Jun10 ?        00:00:00 postgres: sre rviltestbool_b 127.0.0.1(60810) idle
postgres 1187833     930  0 Jun10 ?        00:00:00 postgres: sre tempcli_a 127.0.0.1(60822) idle
postgres 1187836     930  0 Jun10 ?        00:00:00 postgres: sre tempcli_b 127.0.0.1(60836) idle
postgres 1187840     930  0 Jun10 ?        00:00:00 postgres: sre tempcliv2_a 127.0.0.1(60852) idle
postgres 1187841     930  0 Jun10 ?        00:00:00 postgres: sre tempcliv2_b 127.0.0.1(60860) idle
postgres 1187850     930  0 Jun10 ?        00:00:00 postgres: sre whitelist_a 127.0.0.1(60874) idle
postgres 1187866     930  0 Jun10 ?        00:00:00 postgres: sre whitelist_b 127.0.0.1(60876) idle
postgres 1187867     930  0 Jun10 ?        00:00:00 postgres: sre sbcaas_a 127.0.0.1(60880) idle
postgres 1187871     930  0 Jun10 ?        00:00:00 postgres: sre sbcaas_b 127.0.0.1(60894) idle
postgres 1187876     930  0 Jun10 ?        00:00:00 postgres: sre rben_a 127.0.0.1(60904) idle
postgres 1187878     930  0 Jun10 ?        00:00:00 postgres: sre rben_b 127.0.0.1(60910) idlee
Processes handling active transactions can be counted by “grepping” on the string in transaction. If this number increase.
Example:
[root@sre-41-cp2 ~]# ps -ef|grep "postgres: sre"|grep -c "in transaction"
1
Idle connections are the other ones.
Example:
[root@sre-41-cp2 ~]# ps -ef|grep "postgres: sre"|grep -c -v "in transaction"
189
Main Database Replication
Target servers: master EM
On master EM, you can check the main database replication status with the command sudo -u postgres psql -c "select * from pg_stat_replication"
Example:
[root@sre-41-em2 ~]# sudo -u postgres psql -c "select * from pg_stat_replication"
could not change directory to "/root": Permission denied
   pid   | usesysid | usename | application_name | client_addr  | client_hostname | client_port |         bac
kend_start         | backend_xmin |   state   |  sent_lsn   |  write_lsn  |  flush_lsn  | replay_lsn  |    wr
ite_lag    |    flush_lag    |   replay_lag    | sync_priority | sync_state |          reply_time
---------+----------+---------+------------------+--------------+-----------------+-------------+------------
-------------------+--------------+-----------+-------------+-------------+-------------+-------------+------
-----------+-----------------+-----------------+---------------+------------+-------------------------------
    1667 |    16598 | repmgr  | sre41-cp1        | 10.0.161.198 |                 |       35286 | 2026-06-09
08:35:58.737305+02 |              | streaming | 12/52C07FA0 | 12/52C07FA0 | 12/52C07FA0 | 12/52C07FA0 | 00:00
:00.002784 | 00:00:00.004292 | 00:00:00.004294 |             0 | async      | 2026-07-08 13:43:45.126161+02
    1670 |    16598 | repmgr  | sre41-cp2        | 10.0.161.199 |                 |       57160 | 2026-06-09
08:35:59.207572+02 |              | streaming | 12/52C07FA0 | 12/52C07FA0 | 12/52C07FA0 | 12/52C07FA0 | 00:00
:00.002068 | 00:00:00.007004 | 00:00:00.007007 |             0 | async      | 2026-07-08 13:43:45.128566+02
 2129380 |    16598 | repmgr  | sre41-em1        | 10.0.161.196 |                 |       60282 | 2026-06-21
21:19:16.933185+02 |              | streaming | 12/52C07FA0 | 12/52C07FA0 | 12/52C07FA0 | 12/52C07FA0 | 00:00
:00.002111 | 00:00:00.003792 | 00:00:00.004032 |             0 | async      | 2026-07-08 13:43:45.125739+02
(3 rows)
The status of a node can be checked with this query. The result f (false) indicates that the node is not replicating, so master. The result t (true) indicates that the node is replicating from a master node.
Example:
[root@sre-41-em2 ~]# sudo -u postgres psql -c "select * from pg_is_in_recovery()"
could not change directory to "/root": Permission denied
 pg_is_in_recovery
-------------------
 f
(1 row)
Statistics Database Process
Target servers: EMs
You may check that the statistics DB is running by executing the systemctl status influxdb command.
Example:
[root@sre-41-em2 ~]# systemctl status influxdb
● influxdb.service - InfluxDB is an open-source, distributed, time series database
   Loaded: loaded (/usr/lib/systemd/system/influxdb.service; enabled; vendor preset: disabled)
   Active: active (running) since Tue 2026-06-09 08:35:41 CEST; 4 weeks 1 days ago
     Docs: https://docs.influxdata.com/influxdb/
  Process: 854 ExecStart=/usr/lib/influxdb/scripts/influxd-systemd-start.sh (code=exited, status=0/SUCCESS)
 Main PID: 879 (influxd)
    Tasks: 24 (limit: 48944)
   Memory: 772.3M
   CGroup: /system.slice/influxdb.service
           └─879 /usr/bin/influxd
Call Admission Control Database Process
Target servers: EMs (if activated) and CPs
INFO
This check is relevant only if the CAC database (MongoDB-based) was installed on the deployment.
You may check that the CAC DB is running by executing the systemctl status mongod command:
Example:
[root@sre-41-em1 ~]# systemctl status mongod
● mongod.service - MongoDB Database Server
   Loaded: loaded (/usr/lib/systemd/system/mongod.service; enabled; vendor pres>
   Active: active (running) since Tue 2026-05-05 11:53:33 CEST; 2 months 2 days>
     Docs: https://docs.mongodb.org/manual
 Main PID: 1039 (mongod)
   Memory: 420.0M
   CGroup: /system.slice/mongod.service
           └─1039 /usr/bin/mongod -f /etc/mongod.conf
Call Admission Control Database Replication
Target servers: EMs (if activated) and CPs
On any node where MongoDB is activated, run the command mongo --eval 'rs.status()' to return the list of different members belonging to the replica set as well as their current state. There should be only one PRIMARY node and several SECONDARY nodes. Optionally, there may be one or more ARBITER nodes. No nodes should be in other states, such as RECOVERING or others.
The fields lastAppliedWallTime and lastHeartbeat should be recent for all members.
Example:
[root@sre-41-cp1 ~]# mongo --eval 'rs.status()'
MongoDB shell version v5.0.24
connecting to: mongodb://127.0.0.1:27017/?compressors=disabled&gssapiServiceName=mongodb
Implicit session: session { "id" : UUID("f933b280-a3fa-4d69-bc5e-d192d023a4ac") }
MongoDB server version: 5.0.24
{
	"set" : "sre_location",
	"date" : ISODate("2026-07-08T11:52:25.495Z"),
	"myState" : 2,
	"term" : NumberLong(9),
	"syncSourceHost" : "",
	"syncSourceId" : -1,
	"heartbeatIntervalMillis" : NumberLong(2000),
	"majorityVoteCount" : 3,
	"writeMajorityCount" : 3,
	"votingMembersCount" : 4,
	"writableVotingMembersCount" : 4,
	"optimes" : {
		"lastCommittedOpTime" : {
			"ts" : Timestamp(1780986863, 1),
			"t" : NumberLong(9)
		},
		"lastCommittedWallTime" : ISODate("2026-06-09T06:34:23.272Z"),
		"readConcernMajorityOpTime" : {
			"ts" : Timestamp(1780986863, 1),
			"t" : NumberLong(9)
		},
		"appliedOpTime" : {
			"ts" : Timestamp(1780986883, 1),
			"t" : NumberLong(9)
		},
		"durableOpTime" : {
			"ts" : Timestamp(1780986883, 1),
			"t" : NumberLong(9)
		},
		"lastAppliedWallTime" : ISODate("2026-06-09T06:34:43.274Z"),
		"lastDurableWallTime" : ISODate("2026-06-09T06:34:43.274Z")
	},
	"lastStableRecoveryTimestamp" : Timestamp(1780986863, 1),
	"electionParticipantMetrics" : {
		"votedForCandidate" : true,
		"electionTerm" : NumberLong(9),
		"lastVoteDate" : ISODate("2026-06-02T09:56:46.232Z"),
		"electionCandidateMemberId" : 0,
		"voteReason" : "",
		"lastAppliedOpTimeAtElection" : {
			"ts" : Timestamp(1780394079, 3),
			"t" : NumberLong(8)
		},
		"maxAppliedOpTimeInSet" : {
			"ts" : Timestamp(1780394079, 3),
			"t" : NumberLong(8)
		},
		"priorityAtElection" : 1,
		"newTermStartDate" : ISODate("2026-06-02T09:56:47.150Z"),
		"newTermAppliedDate" : ISODate("2026-06-02T09:56:47.746Z")
	},
	"members" : [
		{
			"_id" : 0,
			"name" : "10.0.161.196:27017",
			"health" : 1,
			"state" : 2,
			"stateStr" : "PRIMARY",
			"uptime" : 5536545,
			"optime" : {
				"ts" : Timestamp(1780986883, 1),
				"t" : NumberLong(9)
			},
			"optimeDurable" : {
				"ts" : Timestamp(1780986883, 1),
				"t" : NumberLong(9)
			},
			"optimeDate" : ISODate("2026-06-09T06:34:43Z"),
			"optimeDurableDate" : ISODate("2026-06-09T06:34:43Z"),
			"lastAppliedWallTime" : ISODate("2026-06-09T06:34:43.274Z"),
			"lastDurableWallTime" : ISODate("2026-06-09T06:34:43.274Z"),
			"lastHeartbeat" : ISODate("2026-07-08T11:52:25.106Z"),
			"lastHeartbeatRecv" : ISODate("2026-07-08T11:52:25.363Z"),
			"pingMs" : NumberLong(0),
			"lastHeartbeatMessage" : "",
			"syncSourceHost" : "",
			"syncSourceId" : -1,
			"infoMessage" : "",
			"configVersion" : 1,
			"configTerm" : 9
		{
			"_id" : 2,
			"name" : "10.0.161.198:27017",
			"health" : 1,
			"state" : 2,
			"stateStr" : "SECONDARY",
			"uptime" : 5536555,
			"optime" : {
				"ts" : Timestamp(1780986883, 1),
				"t" : NumberLong(9)
			},
			"optimeDate" : ISODate("2026-06-09T06:34:43Z"),
			"lastAppliedWallTime" : ISODate("2026-06-09T06:34:43.274Z"),
			"lastDurableWallTime" : ISODate("2026-06-09T06:34:43.274Z"),
			"syncSourceHost" : "",
			"syncSourceId" : -1,
			"infoMessage" : "",
			"configVersion" : 1,
			"configTerm" : 9,
			"self" : true,
			"lastHeartbeatMessage" : ""
		},
	],
	"ok" : 1,
	"$clusterTime" : {
		"clusterTime" : Timestamp(1780986883, 1),
		"signature" : {
			"hash" : BinData(0,"AAAAAAAAAAAAAAAAAAAAAAAAAAA="),
			"keyId" : NumberLong(0)
		}
	},
	"operationTime" : Timestamp(1780986883, 1)
}
Disk Usage
Target servers: EMs and CPs
To check the current CPU, memory, and swap utilization of the platform, run the following command on the SRE EM node: /opt/sre/bin/sre-admin status
The output includes a Platform system status section showing resource utilization for each platform node:
Example:
Platform system status
Metric/Server    sre-41-cp1    sre-41-cp2    sre-41-em1    sre-41-em2
---------------        ------------       ------------       ------------       ------------
CPU                     10.4 %            7.7 %             4.5 %             23.5 %
Memory             61.5 %           66.9 %           56.6 %           37.5 %
Swap                  14.5 %            16.9 %          12.0 %            1.1 %
Database Size
To display the size of each PostgreSQL database, run the following query sudo -u postgres psql -c "select datname, pg_database_size(datname) from pg_database. The pg_database_size() function returns the size of each database in bytes.
Example:
[root@sre-41-em2 ~]# sudo -u postgres psql -c "select datname, pg_database_size(datname) from pg_database"
       datname       | pg_database_size
---------------------+------------------
 postgres            |          8774435
 template1           |          8602115
 template0           |          8602115
 repmgr              |         21848867
 demotucana_a        |          8889123
 sre                 |         17146659
 mydb_a              |          9020195
 mydb_b              |          8946467
 orange_a            |          8667651
 orange_b            |          8667651
 demo1405_a          |          8823587
 demo1405_b          |          8823587
 rviltestbool_a      |          8889123
 rviltestbool_b      |          8823587
 temp_cli_a          |          8667651
 temp_cli_b          |          8667651
Tablespaces Size
To display the size of each PostgreSQL tablespace, run the following query. The pg_tablespace_size() function returns the size of each PostgreSQL tablespace in bytes.
TIP
Monitoring tablespace size provides a more accurate view of the disk space consumed by PostgreSQL data than individual database sizes alone.
Example:
[root@sre-41-em2 ~]# sudo -u postgres psql -c "select spcname, pg_tablespace_size(spcname) from pg_tablespace"
   spcname   | pg_tablespace_size
------------+--------------------
 pg_default |         1847849867
 pg_global  |             638752
(2 rows)
SIP Stack
Target servers: CPs
The command kamctl stats provide statistics about the SIP stack processing. This command should be run twice to verify the increase of the counters. Among these, core:rcv_requests, core:rcv_requests_invite, core:rcv_replies and core:fwd_requests should increase under traffic conditions.
Example:
[
[root@sre-41-cp1 ~]# kamctl stats
{
  "jsonrpc":  "2.0",
  "result": [
    "core:bad_URIs_rcvd = 57",
    "core:bad_msg_hdr = 0",
    "core:drop_replies = 0",
    "core:drop_requests = 15",
    "core:err_replies = 0",
    "core:err_requests = 0",
    "core:fwd_replies = 44383",
    "core:fwd_requests = 532471",
    "core:rcv_replies = 44540",
    "core:rcv_replies_18x = 46",
    "core:rcv_replies_1xx = 84",
    "core:rcv_replies_1xx_bye = 0",
    "core:rcv_replies_1xx_cancel = 0",
    "core:rcv_replies_1xx_invite = 84",
    "core:rcv_replies_1xx_message = 0",
    "core:rcv_replies_1xx_prack = 0",
    "core:rcv_replies_1xx_refer = 0",
    "core:rcv_replies_1xx_reg = 0",
    "core:rcv_replies_1xx_update = 0",
    "core:rcv_replies_2xx = 44440",
    "core:rcv_replies_2xx_bye = 33",
    "core:rcv_replies_2xx_cancel = 0",
    "core:rcv_replies_2xx_invite = 27",
    "core:rcv_replies_2xx_message = 0",
    "core:rcv_replies_2xx_prack = 0",
    "core:rcv_replies_2xx_refer = 0",
    "core:rcv_replies_2xx_reg = 0",
    "core:rcv_replies_2xx_update = 0",
    "core:rcv_replies_3xx = 0",
    "core:rcv_replies_3xx_bye = 0",
    "core:rcv_replies_3xx_cancel = 0",
    "core:rcv_replies_3xx_invite = 0",
    "core:rcv_replies_3xx_message = 0",
    "core:rcv_replies_3xx_prack = 0",
    "core:rcv_replies_3xx_refer = 0",
    "core:rcv_replies_3xx_reg = 0",
    "core:rcv_replies_3xx_update = 0",
    "core:rcv_replies_401 = 0",
    "core:rcv_replies_404 = 5",
    "core:rcv_replies_407 = 0",
    "core:rcv_replies_480 = 0",
    "core:rcv_replies_486 = 0",
    ...
    "sl:1xx_replies = 54",
    "sl:200_replies = 28420",
    "sl:202_replies = 0",
    "sl:2xx_replies = 0",
    "sl:300_replies = 0",
    "sl:301_replies = 0",
    "sl:302_replies = 0",
    "sl:3xx_replies = 0",
    "sl:400_replies = 1",
    "sl:401_replies = 106",
    "sl:403_replies = 3",
    "sl:407_replies = 0",
    "sl:408_replies = 0",
    "sl:483_replies = 0",
    "sl:4xx_replies = 0",
    "sl:500_replies = 9",
    "sl:5xx_replies = 21",
    "sl:6xx_replies = 0",
    "sl:failures = 0",
    "sl:received_ACKs = 15",
    "sl:sent_err_replies = 0",
    "sl:sent_replies = 28614",
SIP Stack processes can be listed with the ps command. Their number should remain stable.
Example:
[root@sre-41-cp1 ~]# ps -ef|grep kamailio|grep -v grep
kamailio 4097432       1  0 May20 ?        00:00:00 /usr/sbin/kamailio --atexit=no -DD -P /run/kamailio/kamailio.pid -f /etc/kamailio/kamailio.cfg -m 64 -M 4
kamailio 4097451 4097432  0 May20 ?        00:00:00 /usr/sbin/kamailio --atexit=no -DD -P /run/kamailio/kamailio.pid -f /etc/kamailio/kamailio.cfg -m 64 -M 4
kamailio 4097452 4097432  0 May20 ?        00:00:00 /usr/sbin/kamailio --atexit=no -DD -P /run/kamailio/kamailio.pid -f /etc/kamailio/kamailio.cfg -m 64 -M 4
kamailio 4097453 4097432  0 May20 ?        00:00:00 /usr/sbin/kamailio --atexit=no -DD -P /run/kamailio/kamailio.pid -f /etc/kamailio/kamailio.cfg -m 64 -M 4
kamailio 4097454 4097432  0 May20 ?        00:00:00 /usr/sbin/kamailio --atexit=no -DD -P /run/kamailio/kamailio.pid -f /etc/kamailio/kamailio.cfg -m 64 -M 4
kamailio 4097455 4097432  0 May20 ?        00:00:09 /usr/sbin/kamailio --atexit=no -DD -P /run/kamailio/kamailio.pid -f /etc/kamailio/kamailio.cfg -m 64 -M 4
kamailio 4097456 4097432  0 May20 ?        00:00:10 /usr/sbin/kamailio --atexit=no -DD -P /run/kamailio/kamailio.pid -f /etc/kamailio/kamailio.cfg -m 64 -M 4
kamailio 4097458 4097432  0 May20 ?        00:00:11 /usr/sbin/kamailio --atexit=no -DD -P /run/kamailio/kamailio.pid -f /etc/kamailio/kamailio.cfg -m 64 -M 4
kamailio 4097464 4097432  0 May20 ?        00:00:10 /usr/sbin/kamailio --atexit=no -DD -P /run/kamailio/kamailio.pid -f /etc/kamailio/kamailio.cfg -m 64 -M 4
kamailio 4097465 4097432  0 May20 ?        00:01:57 /usr/sbin/kamailio --atexit=no -DD -P /run/kamailio/kamailio.pid -f /etc/kamailio/kamailio.cfg -m 64 -M 4
kamailio 4097466 4097432  0 May20 ?        00:01:46 /usr/sbin/kamailio --atexit=no -DD -P /run/kamailio/kamailio.pid -f /etc/kamailio/kamailio.cfg -m 64 -M 4
kamailio 4097475 4097432  0 May20 ?        00:01:51 /usr/sbin/kamailio --atexit=no -DD -P /run/kamailio/kamailio.pid -f /etc/kamailio/kamailio.cfg -m 64 -M 4
kamailio 4097476 4097432  0 May20 ?        00:01:49 /usr/sbin/kamailio --atexit=no -DD -P /run/kamailio/kamailio.pid -f /etc/kamailio/kamailio.cfg -m 64 -M 4
kamailio 4097477 4097432  0 May20 ?        00:03:44 /usr/sbin/kamailio --atexit=no -DD -P /run/kamailio/kamailio.pid -f /etc/kamailio/kamailio.cfg -m 64 -M 4
kamailio 4097478 4097432  0 May20 ?        00:47:07 /usr/sbin/kamailio --atexit=no -DD -P /run/kamailio/kamailio.pid -f /etc/kamailio/kamailio.cfg -m 64 -M 4
kamailio 4097479 4097432  0 May20 ?        00:03:52 /usr/sbin/kamailio --atexit=no -DD -P /run/kamailio/kamailio.pid -f /etc/kamailio/kamailio.cfg -m 64 -M 4
kamailio 4097480 4097432  0 May20 ?        00:15:27 /usr/sbin/kamailio --atexit=no -DD -P /run/kamailio/kamailio.pid -f /etc/kamailio/kamailio.cfg -m 64 -M 4
kamailio 4097482 4097432  0 May20 ?        00:00:00 /usr/sbin/kamailio --atexit=no -DD -P /run/kamailio/kamailio.pid -f /etc/kamailio/kamailio.cfg -m 64 -M 4
kamailio 4097483 4097432  0 May20 ?        00:15:19 /usr/sbin/kamailio --atexit=no -DD -P /run/kamailio/kamailio.pid -f /etc/kamailio/kamailio.cfg -m 64 -M 4
kamailio 4097506 4097432  0 May20 ?        00:00:34 /usr/sbin/kamailio --atexit=no -DD -P /run/kamailio/kamailio.pid -f /etc/kamailio/kamailio.cfg -m 64 -M 4
kamailio 4097507 4097432  0 May20 ?        00:01:48 /usr/sbin/kamailio --atexit=no -DD -P /run/kamailio/kamailio.pid -f /etc/kamailio/kamailio.cfg -m 64 -M 4
kamailio 4097510 4097432  0 May20 ?        00:01:53 /usr/sbin/kamailio --atexit=no -DD -P /run/kamailio/kamailio.pid -f /etc/kamailio/kamailio.cfg -m 64 -M 4
kamailio 4097511 4097432  0 May20 ?        00:01:51 /usr/sbin/kamailio --atexit=no -DD -P /run/kamailio/kamailio.pid -f /etc/kamailio/kamailio.cfg -m 64 -M 4
kamailio 4097520 4097432  0 May20 ?        00:01:47 /usr/sbin/kamailio --atexit=no -DD -P /run/kamailio/kamailio.pid -f /etc/kamailio/kamailio.cfg -m 64 -M 4
kamailio 4097521 4097432  0 May20 ?        00:01:00 /usr/sbin/kamailio --atexit=no -DD -P /run/kamailio/kamailio.pid -f /etc/kamailio/kamailio.cfg -m 64 -M 4
Detailed information about the role of each processes can be obtained with the kamctl ps command.
Example:
[root@sre-41-cp1 ~]# kamctl ps
{
  "jsonrpc":  "2.0",
  "result": [
    {
      "IDX":  0,
      "PID":  4097432,
      "DSC":  "main process - attendant"
    }, {
      "IDX":  1,
      "PID":  4097451,
      "DSC":  "udp receiver child=0 sock=127.0.0.1:5060"
    }, {
      "IDX":  2,
      "PID":  4097452,
      "DSC":  "udp receiver child=1 sock=127.0.0.1:5060"
    }, {
      "IDX":  3,
      "PID":  4097453,
      "DSC":  "udp receiver child=2 sock=127.0.0.1:5060"
    }, {
      "IDX":  4,
      "PID":  4097454,
      "DSC":  "udp receiver child=3 sock=127.0.0.1:5060"
    }, {
      "IDX":  5,
      "PID":  4097455,
      "DSC":  "udp receiver child=0 sock=10.0.161.198:5060"
    }, {
      "IDX":  6,
      "PID":  4097456,
      "DSC":  "udp receiver child=1 sock=10.0.161.198:5060"
    }, {
      "IDX":  7,
      "PID":  4097458,
      "DSC":  "udp receiver child=2 sock=10.0.161.198:5060"
    }, {
      "IDX":  8,
      "PID":  4097464,
      "DSC":  "udp receiver child=3 sock=10.0.161.198:5060"
    }, {
      "IDX":  9,
      "PID":  4097465,
      "DSC":  "udp receiver child=0 sock=10.0.161.201:5060"
    }, {
      "IDX":  10,
      "PID":  4097466,
      "DSC":  "udp receiver child=1 sock=10.0.161.201:5060"
    }, {
      "IDX":  11,
      "PID":  4097475,
      "DSC":  "udp receiver child=2 sock=10.0.161.201:5060"
    }, {
      "IDX":  12,
      "PID":  4097476,
      "DSC":  "udp receiver child=3 sock=10.0.161.201:5060"
    }, {
      "IDX":  13,
      "PID":  4097477,
      "DSC":  "slow timer"
    }, {
      "IDX":  14,
      "PID":  4097478,
      "DSC":  "timer"
    }, {
      "IDX":  15,
      "PID":  4097479,
      "DSC":  "secondary timer"
    }, {
      "IDX":  16,
      "PID":  4097480,
      "DSC":  "JSONRPCS FIFO"
    }, {
      "IDX":  17,
      "PID":  4097482,
      "DSC":  "JSONRPCS DATAGRAM"
    }, {
      "IDX":  18,
      "PID":  4097483,
      "DSC":  "ctl handler"
    }, {
      "IDX":  19,
      "PID":  4097506,
      "DSC":  "Dialog Clean Timer"
    }, {
      "IDX":  20,
      "PID":  4097507,
      "DSC":  "tcp receiver (generic) child=0"
    }, {
      "IDX":  21,
      "PID":  4097510,
      "DSC":  "tcp receiver (generic) child=1"
    }, {
      "IDX":  22,
      "PID":  4097511,
      "DSC":  "tcp receiver (generic) child=2"
    }, {
      "IDX":  23,
      "PID":  4097520,
      "DSC":  "tcp receiver (generic) child=3"
    }, {
      "IDX":  24,
      "PID":  4097521,
      "DSC":  "tcp main process"
    }
  ],
  "id": 2830396
}
SIP Agents Monitoring
Target servers: master EM
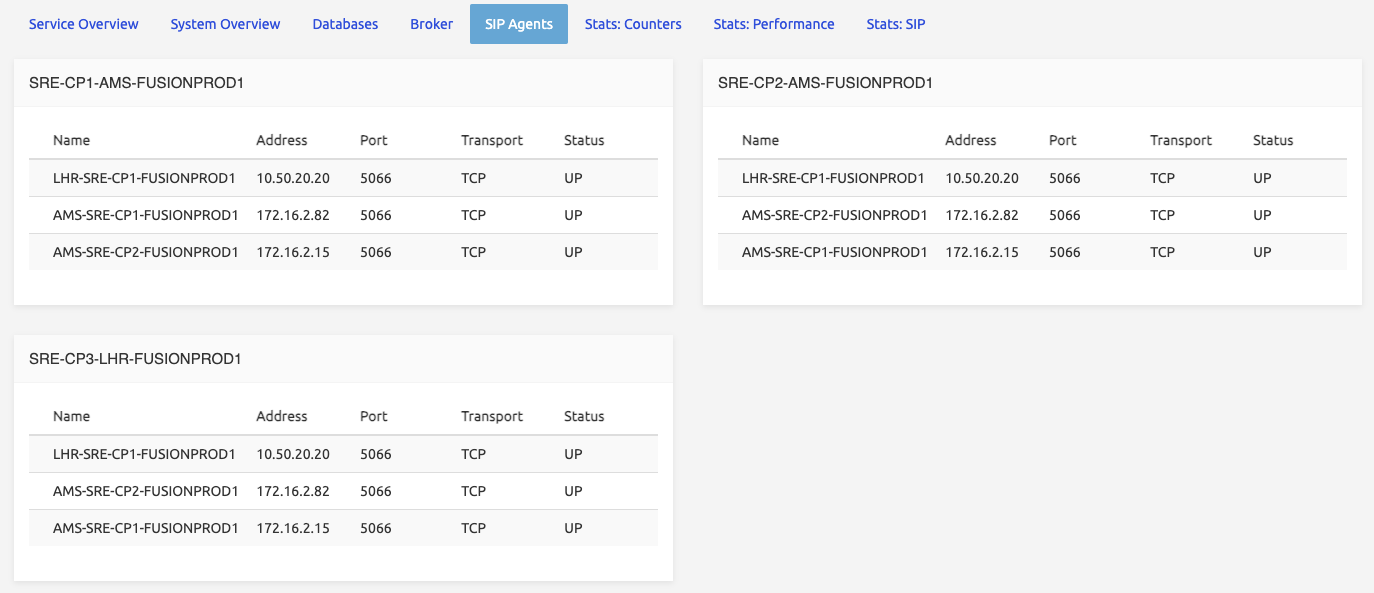
The status of the SIP agents monitored by SRE can be viewed from the GUI dashboard under the SRE tab. Unless there are known issues with the probed agents, the status of all agents should be UP.
Accounting Generation
Target servers: master EM
Run the command /opt/sre/bin/sre-admin monitor accounting summary to get the count of currently active calls from an accounting point of view.
Example:
[root@sre-41-em2 ~]# /opt/sre/bin/sre-admin monitor accounting summary
Hostname      Open calls
----------  ------------
sre-41-cp1             7
total                  7
List files in the directory /data/sre/accounting/ to ensure that accounting files are properly generated. There should be exactly one CDR file suffixed with .inprogress and a recent timestamp in the filename and possibly several CDR files that are not updated anymore.
Example:
[root@sre-41-em2 ~~]$ ls -lrt /data/sre/accounting/
total 124216
drwxrwxr-x. 3 sre       sre             19 Mar 19 14:09 http
drwxrwxr-x. 2 sre       sre              6 Mar 19 14:09 events
drwxrwxr-x. 3 sre       sre             19 Mar 19 14:09 enum
-rw-r--r--  1 sre       sre       46866966 Jun 20 13:04 cdr-2024-06-20T13:00:00
-rw-r--r--  1 sre       sre       46682213 Jun 20 13:09 cdr-2024-06-20T13:05:00
drwxrwxr-x. 2 sre       sre             71 Jun 20 13:13 state
-rw-r--r--  1 sre       sre       28939111 Jun 20 13:13 cdr-2024-06-20T13:10:00.inprogress
Accounting Synchronization
Target servers: EMs
The accounting synchronization mechanism between the two EMs can be verified by listing the files in /data/sre/accounting/state. The file suffixed with .checkpoint represents the last checkpoint of the accounting status at that moment and should be identical on both servers. The file suffixed with .oplog contains the delta of accounting information relative to the last checkpoint file. This file is continuously synchronized between both EMs and should be approximately the same size.
Example:
[root@sre-41-em2 ~]$ ls -lrt /data/sre/accounting/state
total 45500
-rw-r--r-- 1 sre sre 29615256 Jun 20 13:15 0000000000003ef3.checkpoint
-rw-r--r-- 1 sre sre 13976487 Jun 20 13:15 0000000000003ef3.oplog

[root@sre-41-em1 ~]$ ls -lrt /data/sre/accounting/state
total 59388
-rw-r--r-- 1 sre sre 29615256 Jun 20 13:15 0000000000003ef3.checkpoint
-rw-r--r-- 1 sre sre 25596460 Jun 20 13:16 0000000000003ef3.oplog