Management Graphical Interface
INFO
This chapter makes numerous references to SRE processes. To help understand what they are and what they do, we highly recommend reading first SRE Logs and Processes.
On the EM nodes, a GUI is built around an HTML5 framework to provide a management and administration interface. All changes made through the interface are recorded in the master database after pressing the Save button (or on each click in the SLE).
The GUI presents 5 modules to the administrators in the top menu bar:
the Dashboard, the Data Administration, the Datamodel, and the System, which are described below,
the Service Logic Editor, which is described in a separate document.
The top menu bar also shows, on the right, the logged in User's full name, four alarm controls for the alarms raised, and the SRE ID.
WARNING
Be careful: the indication of the SRE ID must show the [master] information. Being logged in with the URL of a [standby] machine means read-only mode for all attempted operations (typically: editing a service logic will be impossible).

When the SRE is accessed for the first time in operation mode, or when the session has expired, a standard login screen appears. It has to be filled with any of the user credentials created during configuration. Note that the username value expected is the user ID, not the user's full name (see Permissions below).
After logging, the Dashboard page appears and the logged-in User full name is shown in the top menu bar.
This control allows:
- changing the password of the logged-in user
- logging out, to log in with a different user name (typically, switching from user to admin or the reverse).
Dashboard
The Dashboard presents 9 tabs: Service Overview, System Overview, Databases, Broker, SIP Agents, Stats: Counters, Stats: Performance, Stats: SIP and Stats:Historical.
These tabs provide, for each node making the solution (EMs, CPs), operational information and statistics allowing to control how the SRE system and SRE processes are behaving.
The sre-manager process collects the relevant stats from the various processes (sre-call-processor, sre-broker, sre-health-monitor, etc.) and provides them to the sre-gui process for display in the GUI.
Service Overview
The Service Overview tab shows by default the following graphs in secondary tabs:
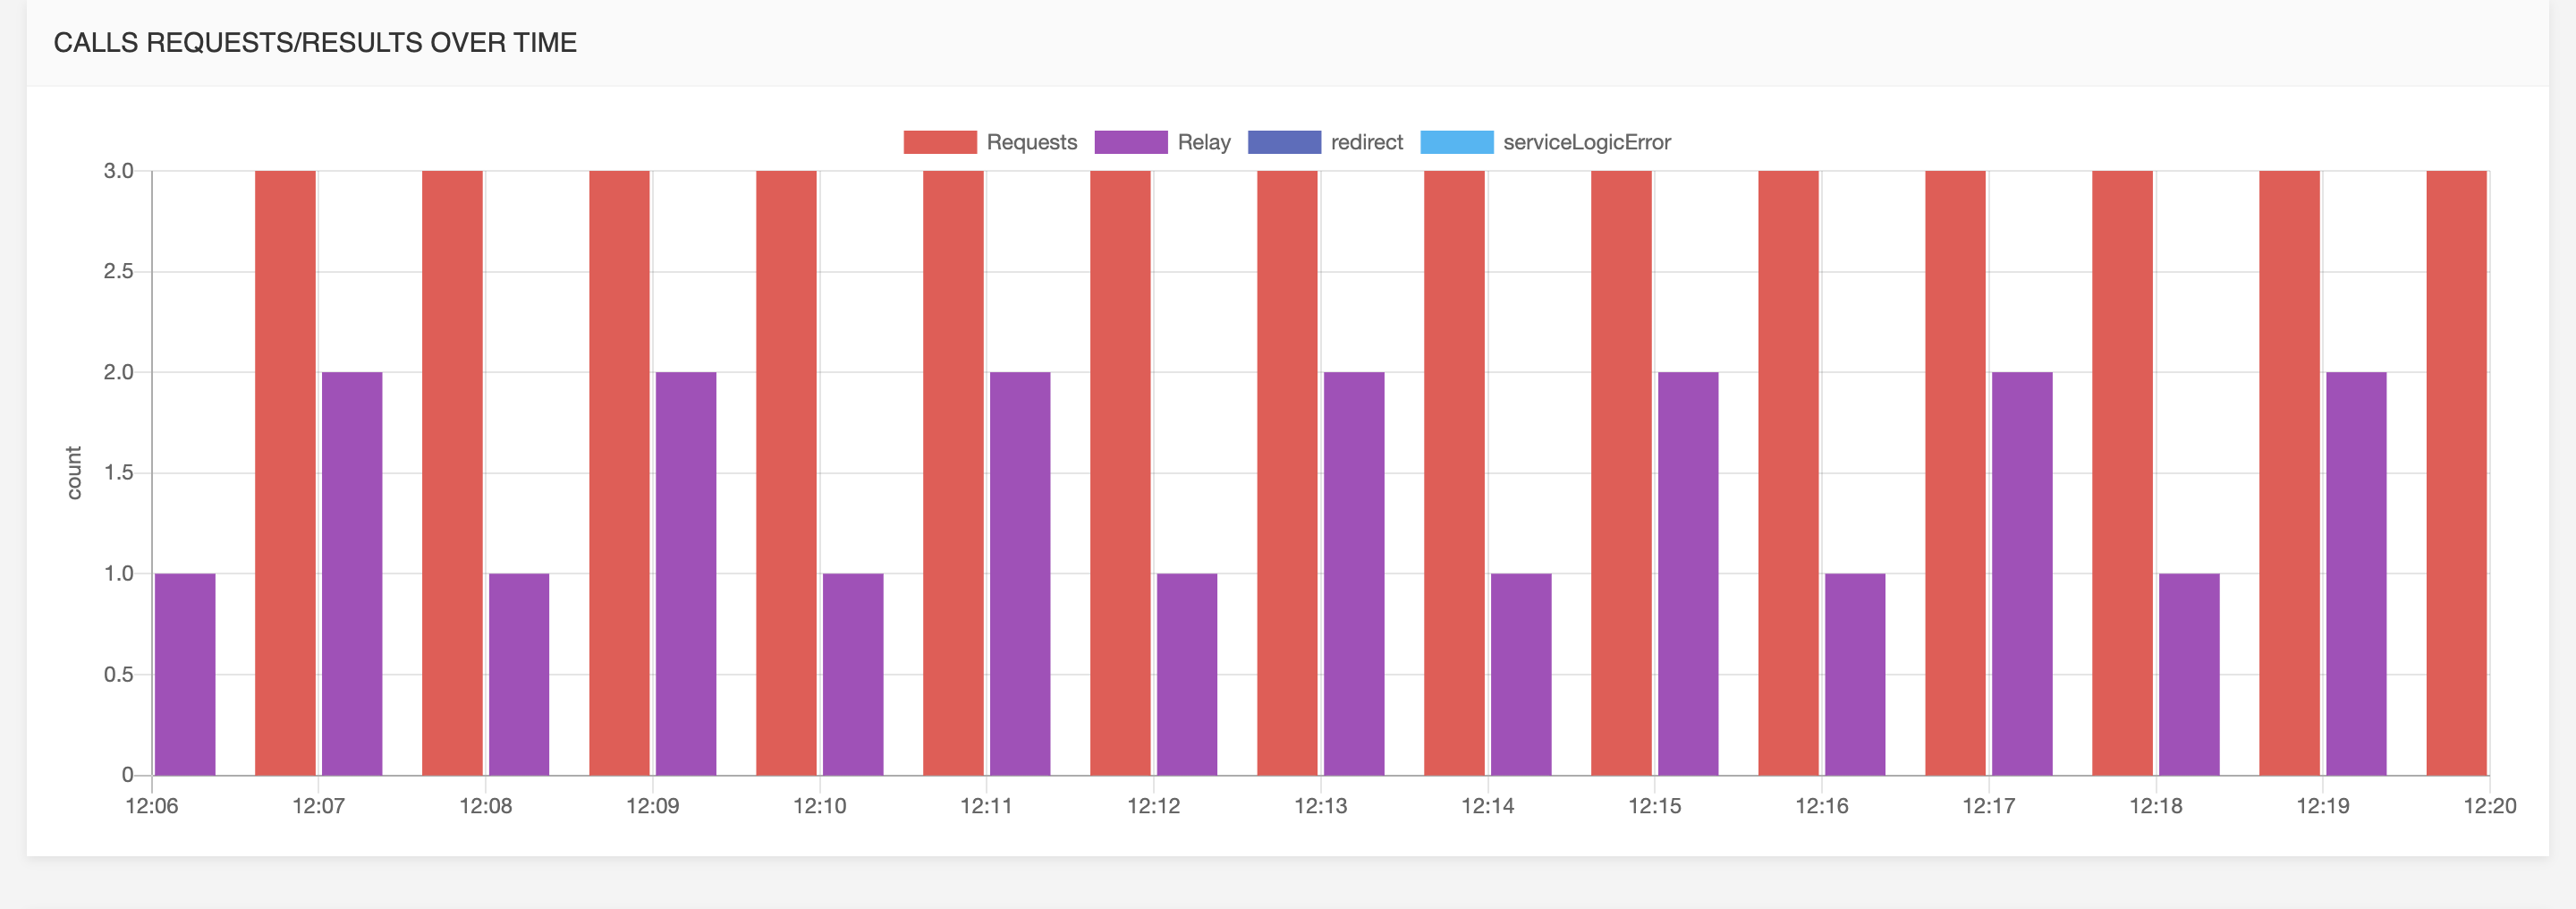
Requests / Responses
Call requests and responses over time: requests are for instance SIP INVITEs, responses are for instance redirect, relay, loop, etc.
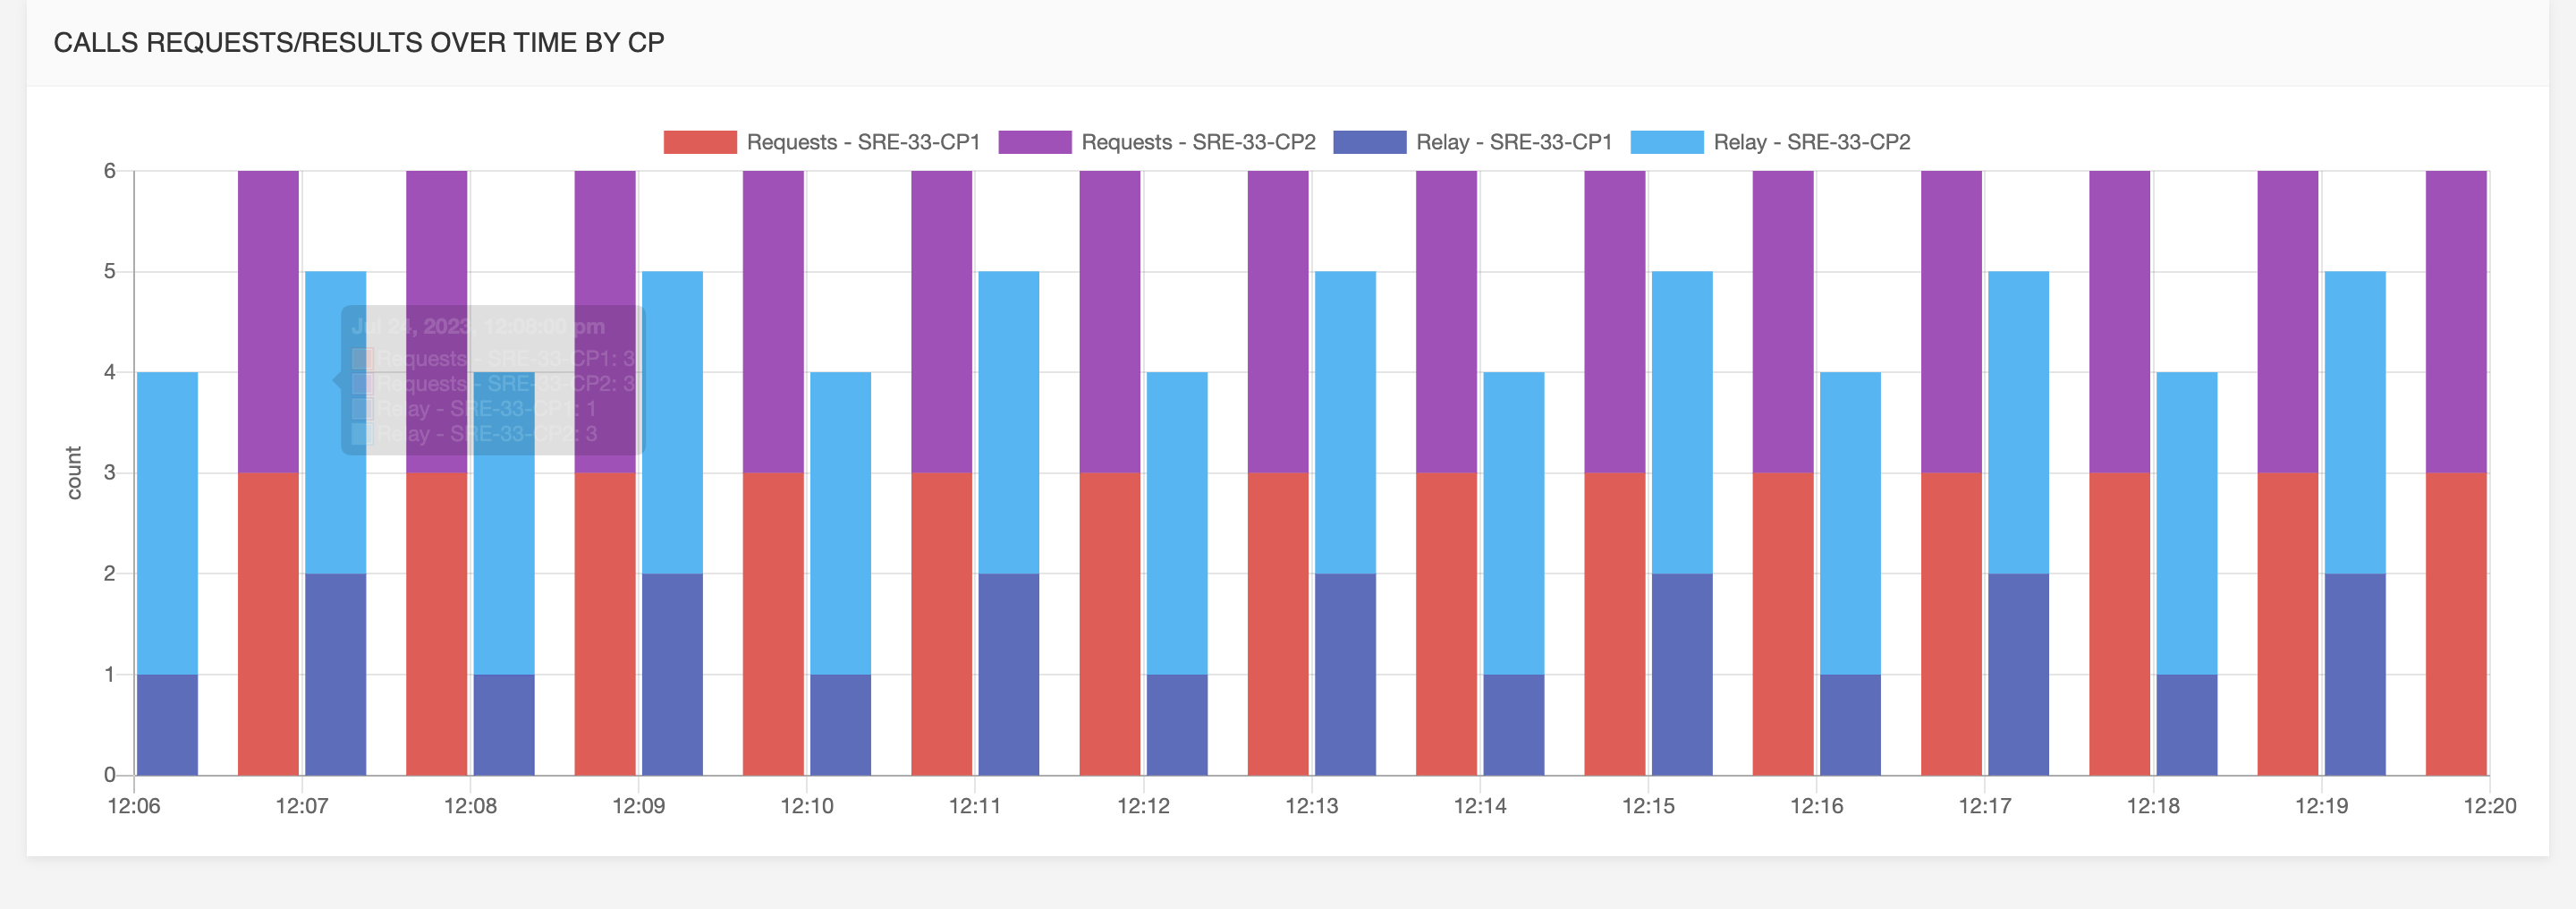
Call requests and responses over time per call processor
Call Performance
Call rate over time per call processor: The number of requests per second from the system on those requests for each call processor.
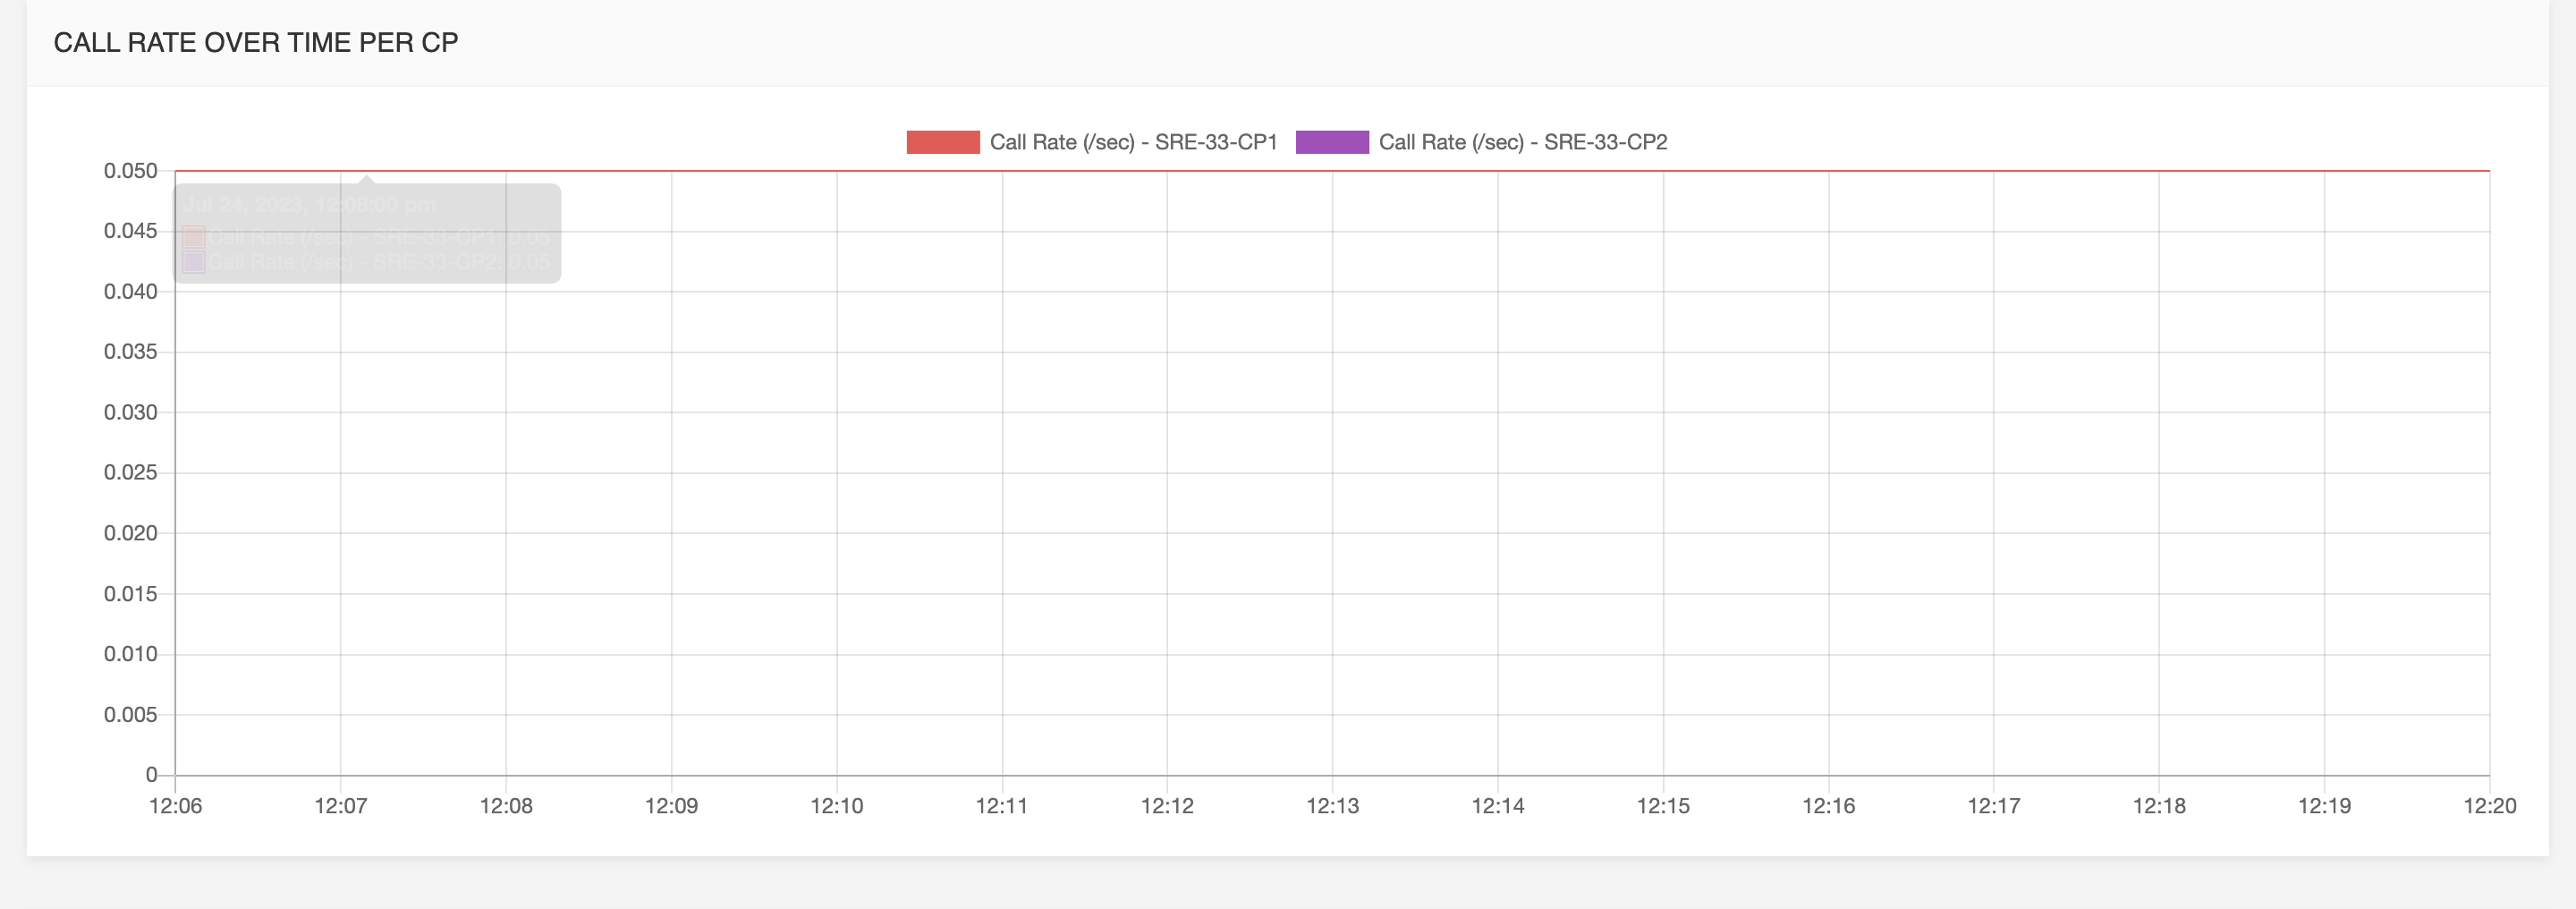
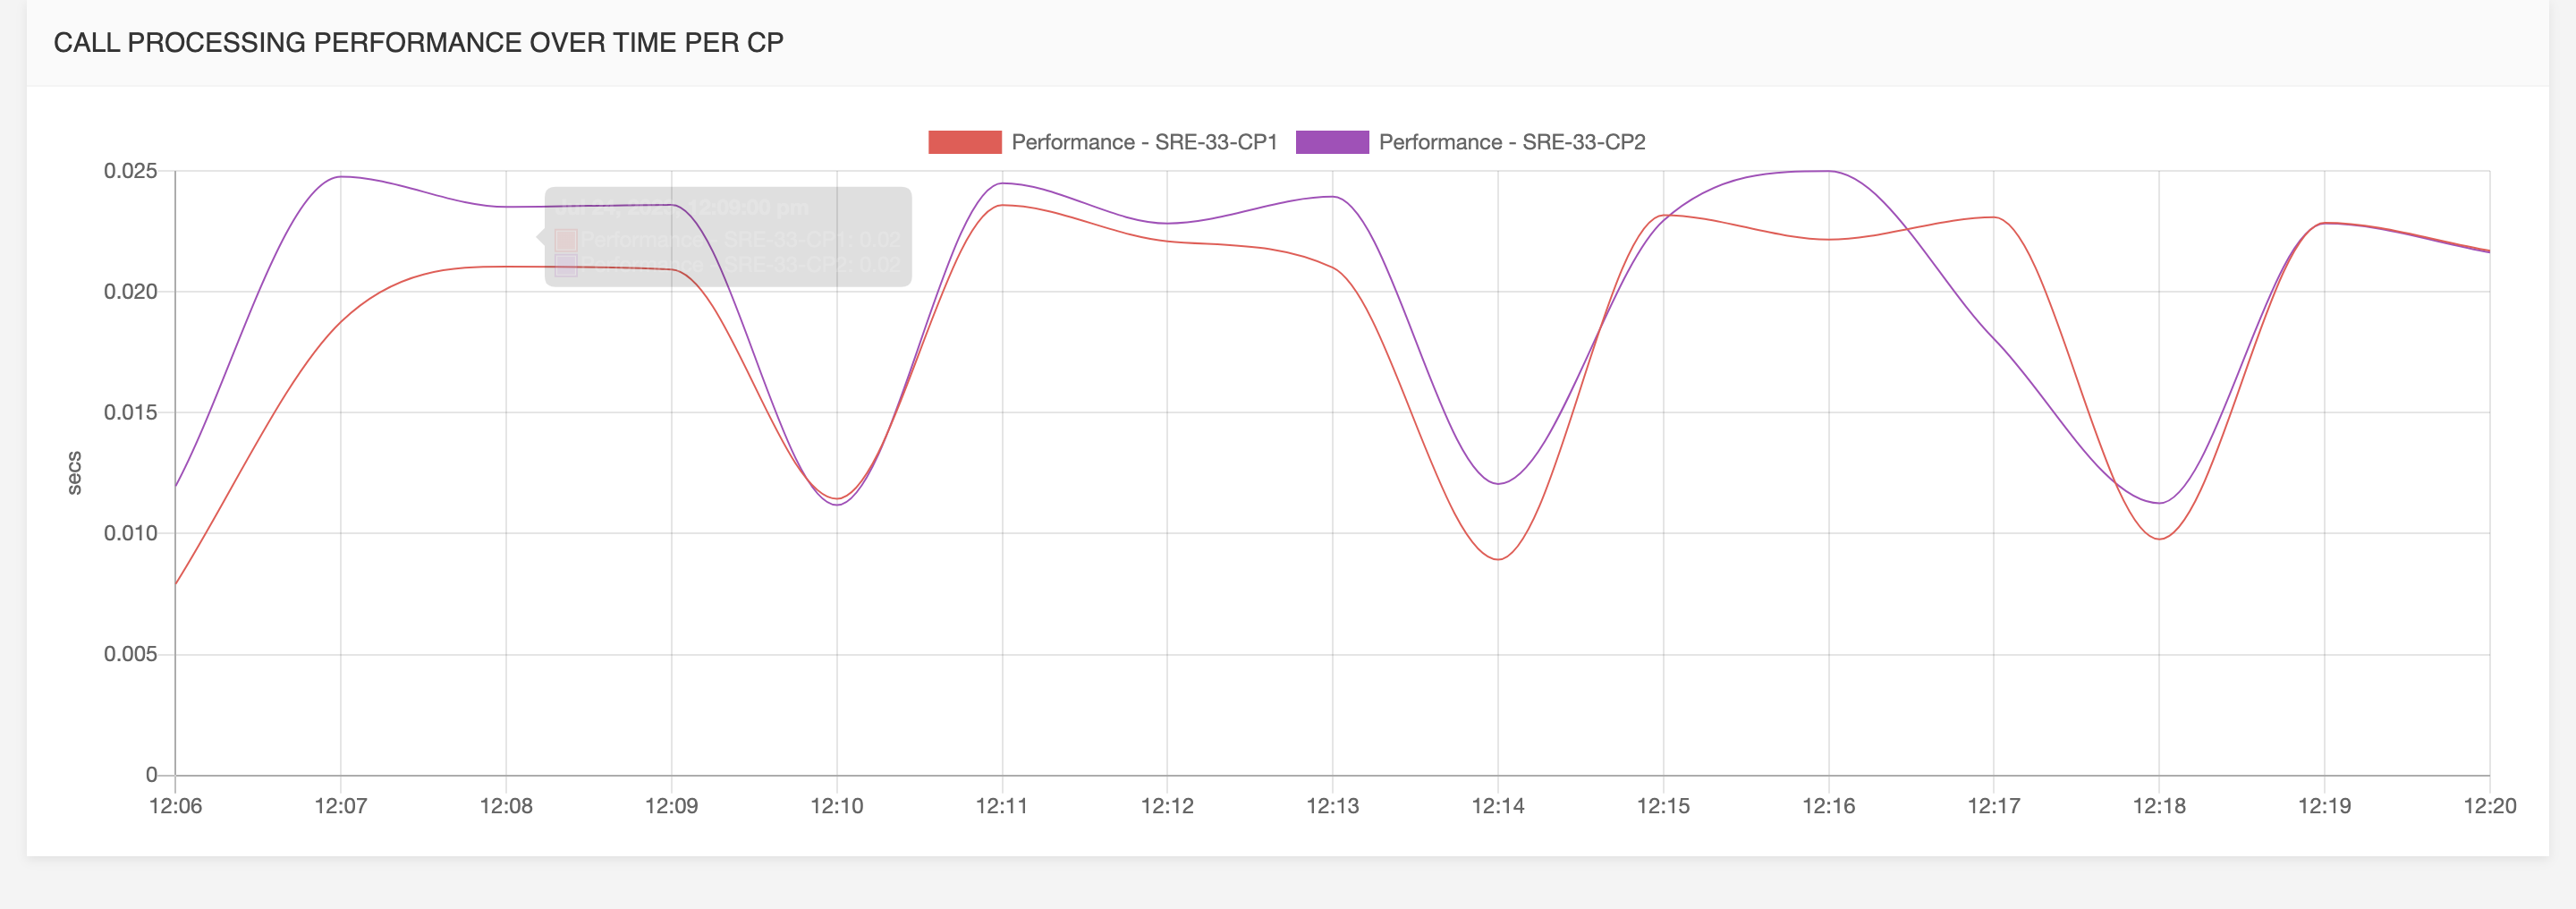
Call processing performance over time per call processor:
the average response time from the system on those requests.
Active Calls
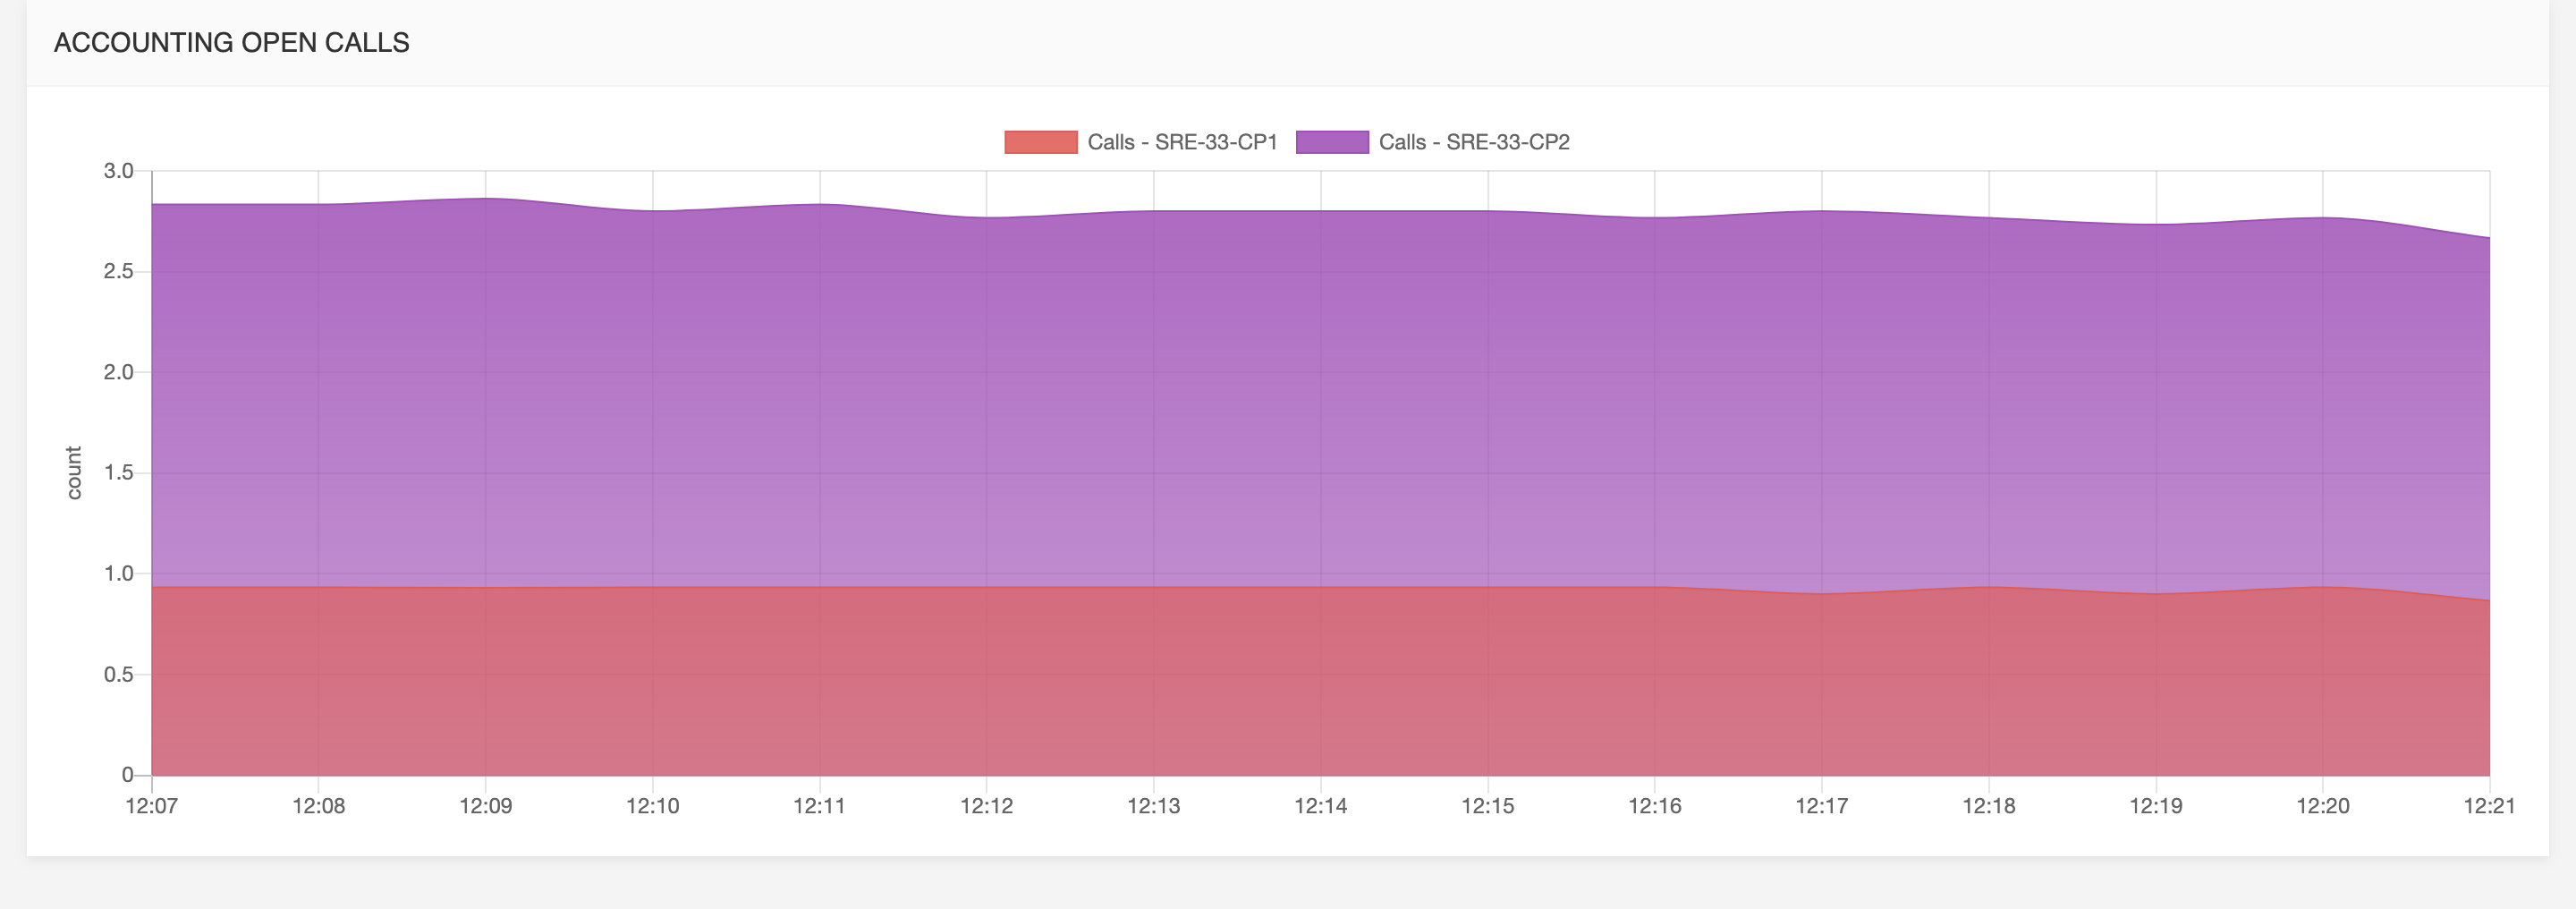
Accounting open calls:
when it comes to SIP and proxy functionality, this graph shows the trend of active calls in the network.
INFO
Individual values can be viewed when clicking on dots plotted in the graph.
All metrics are available for the following relative time frames, selectable in the drop-down list at the top right:
- last 15 mins
- last hour
- last 24h
- last 48h
- last 7 days
An absolute time frame is also available by selecting the absolute radio-button and selecting starting and ending date.
Dashboard customization
Layout, tabs and graphs are customizable by clicking the edit button on the right.
After entering the edit-mode it's possible to exit the edit-mode by saving the new dashboard , cancel all changes or reset the dashboard to the default one.

Tabs
It is possible to add new tab by clicking the new tab link.

on the bottom bar, it's possible to rename an existing tab or to delete it.

Tab layout
To add graphs to a tab click the add row combo box and select how many panels need to be added in the new row.
Graphs can be moved left and right with angle-bracket buttons, edited with edit icon or removed by clicking on the X button.
Graphs
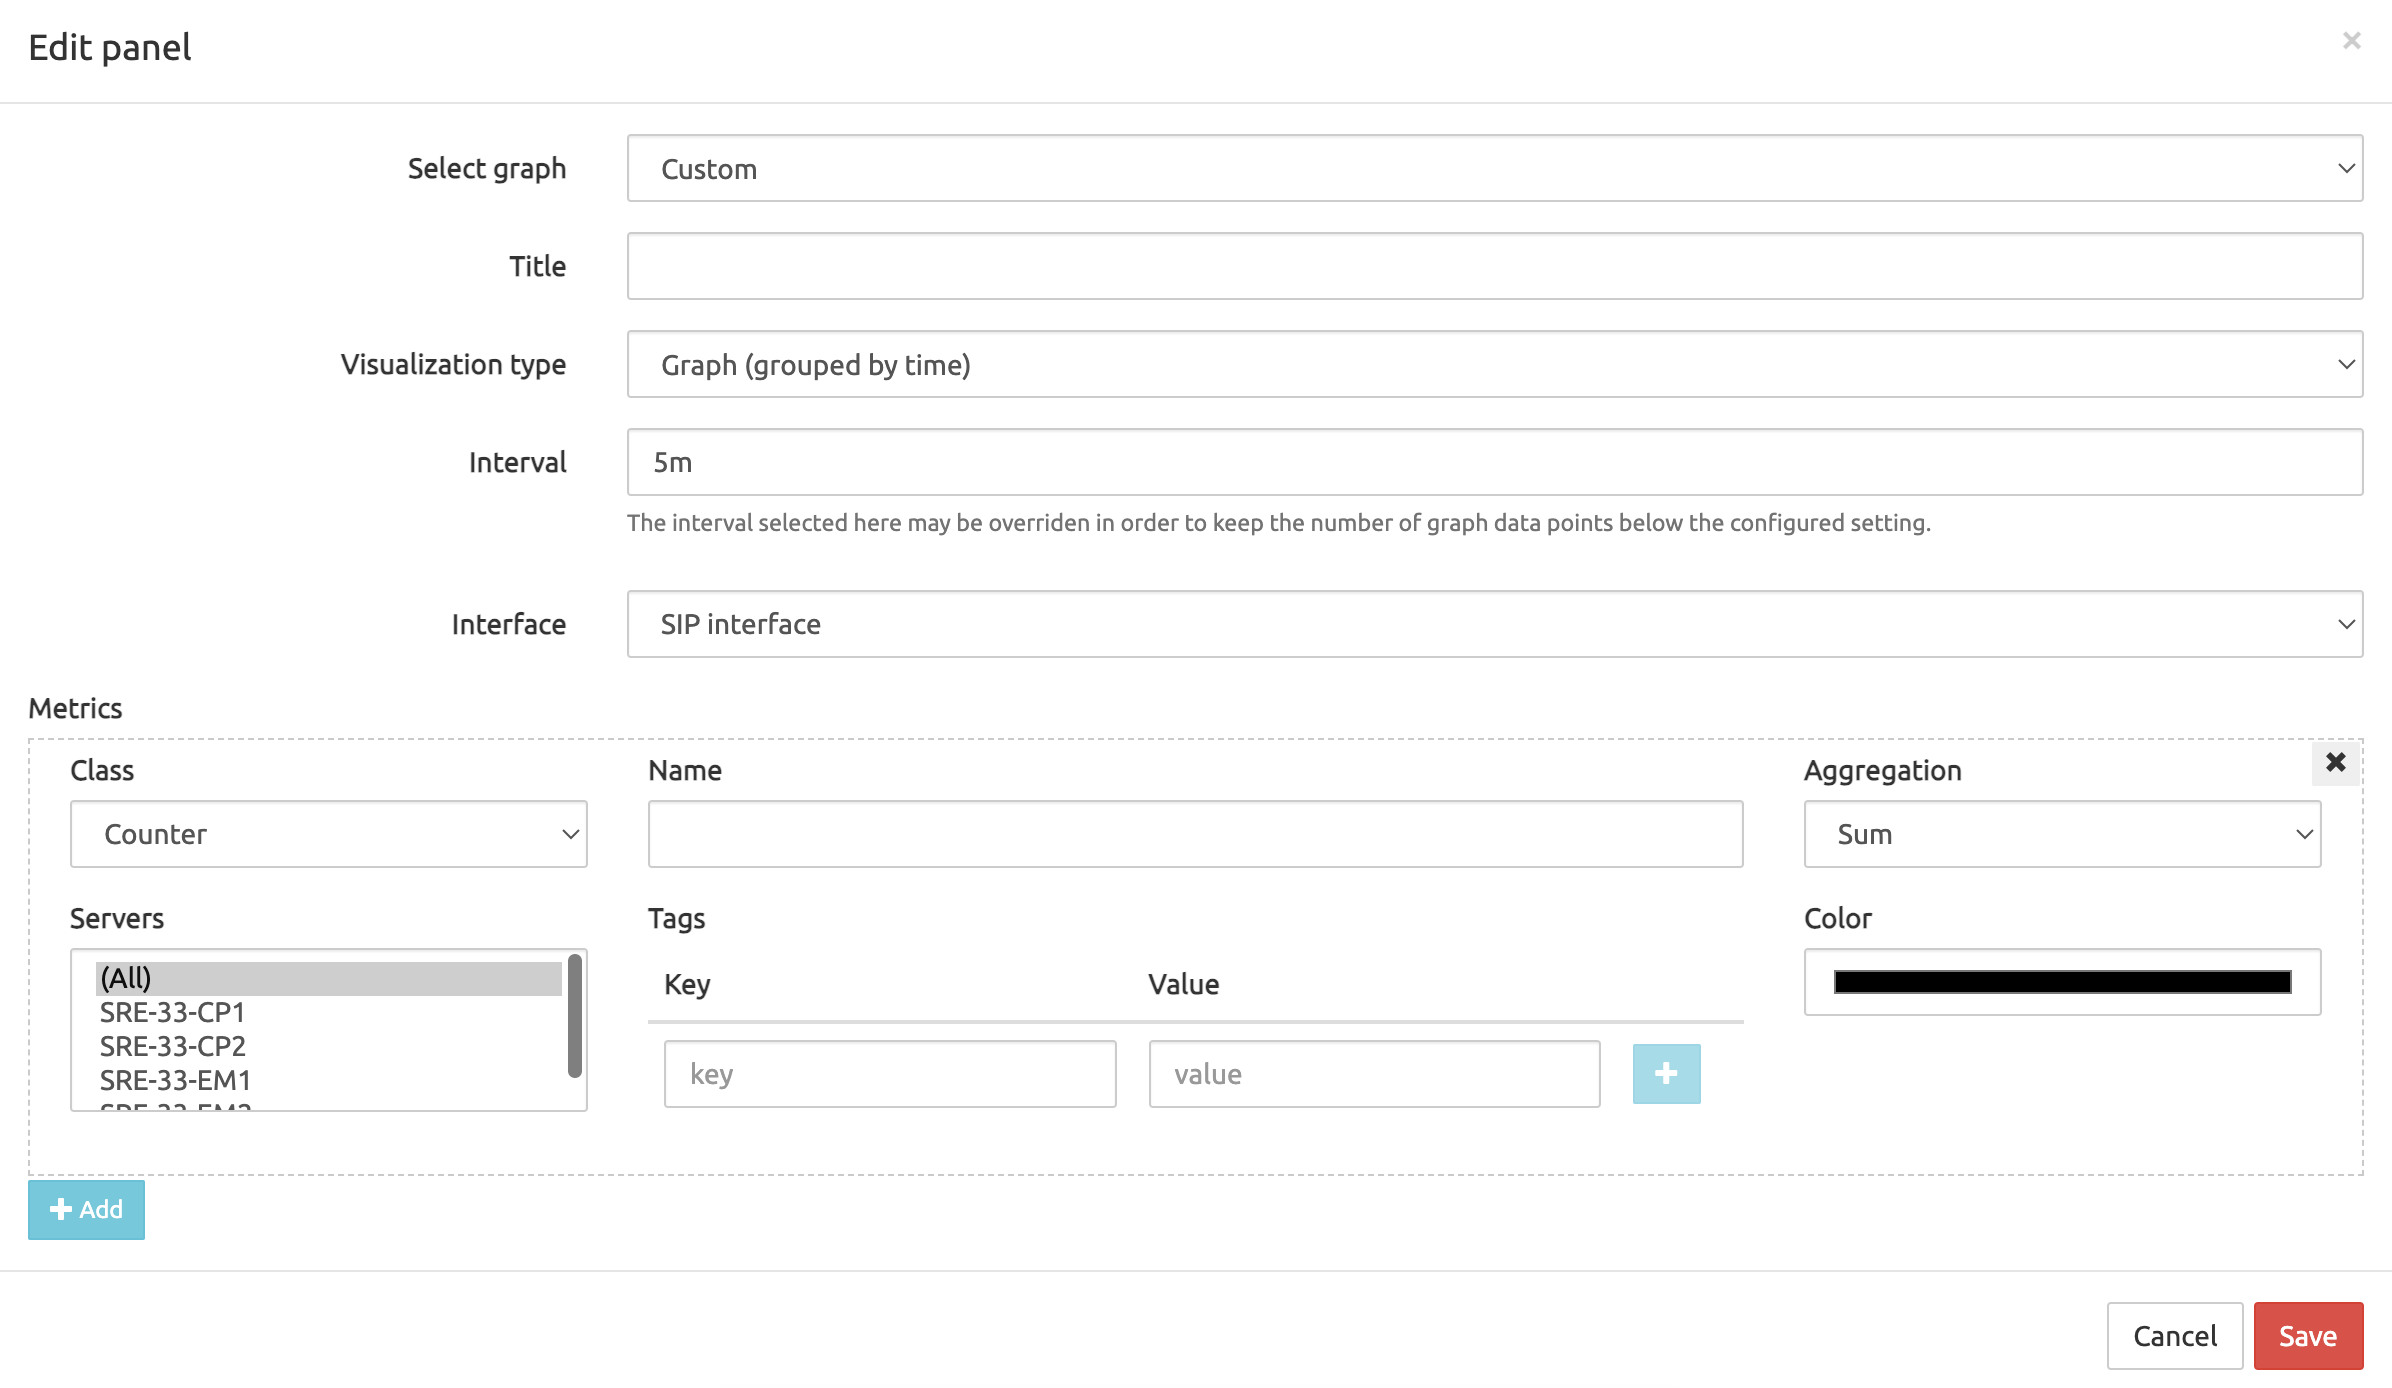
After clicking the edit icon a new modal allows to set different options for the new graph:
Select Graph: these are predefined graphs that can be picked, it is possible to create a custom graph by selecting the Custom option.
Title: label for this graph
Visualization Type: one of the following type can be selected:
- Graph: line for each metric over time
- Histogram (grouped by metric): bars grouped by metrics
- Pie Chart (grouped by metric): pie of all metrics
- Histogram (grouped by tag): bars grouped by metrics
- Pie Chart (grouped by tag): pie grouped by tags
Interval: time window used for aggregation
Interface:
- Generic/System: for system metrics
- SIP
- HTTP
- ENUM
By clicking on the add button a new metric is added to the graph. Metric options are the following:
- Class: counter or sample
- Name: name of the metric to be added
- Aggregation: sum or rate
- Servers: a list of server to (only for Graph visualization type)
- Tags: a list of key-values to filter (only for Graph visualization type)
- Color: select a color for this metric
System Overview
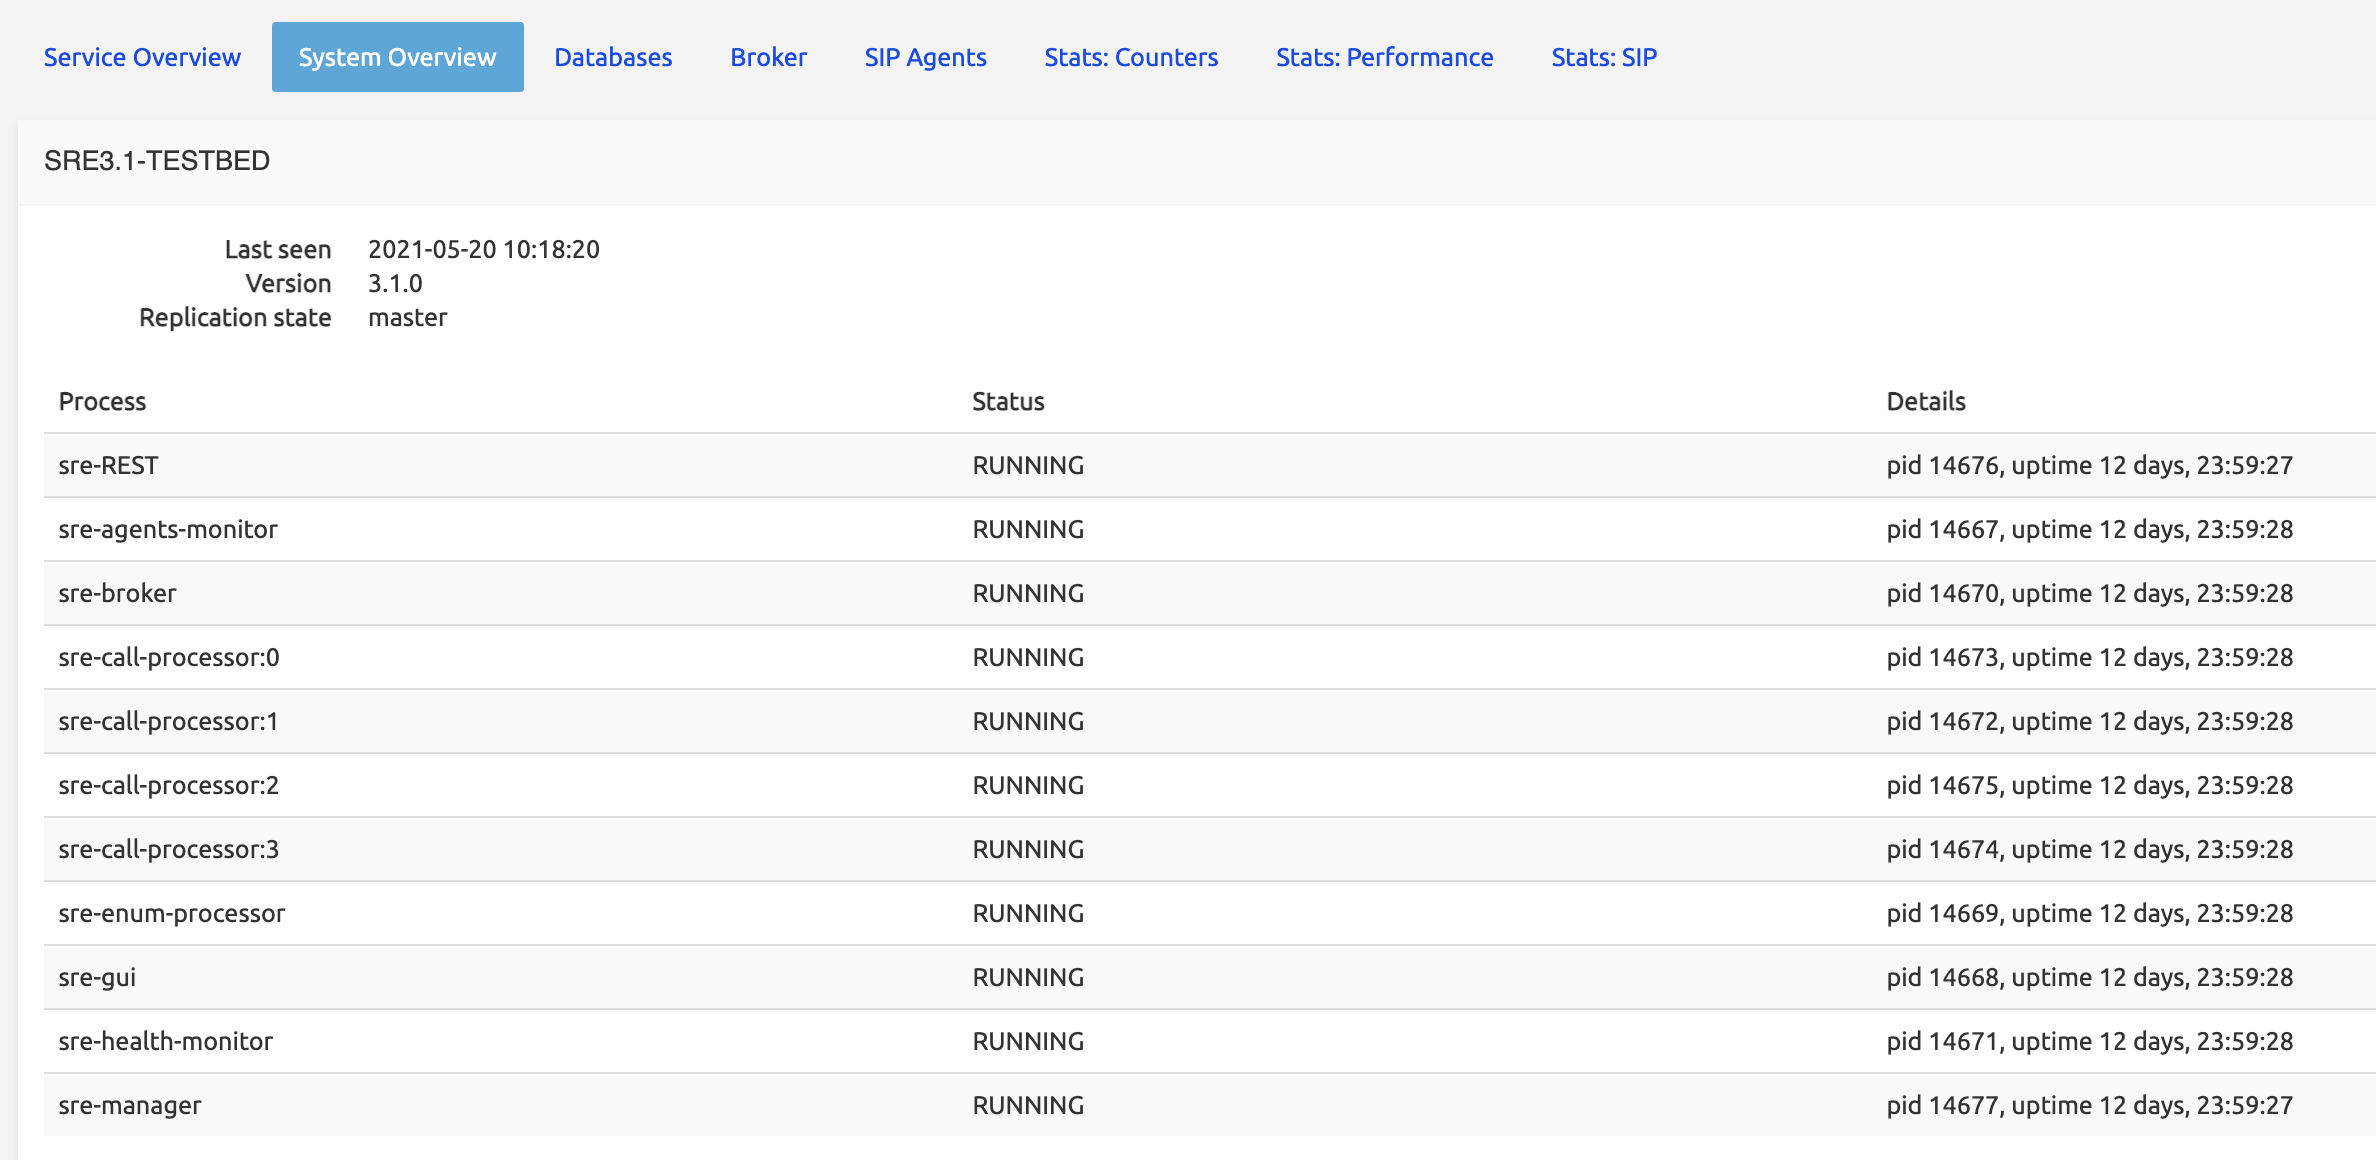
The System Overview tab displays information about the servers, with Element Manager servers listed at the top:
and Call Processing servers at the bottom.
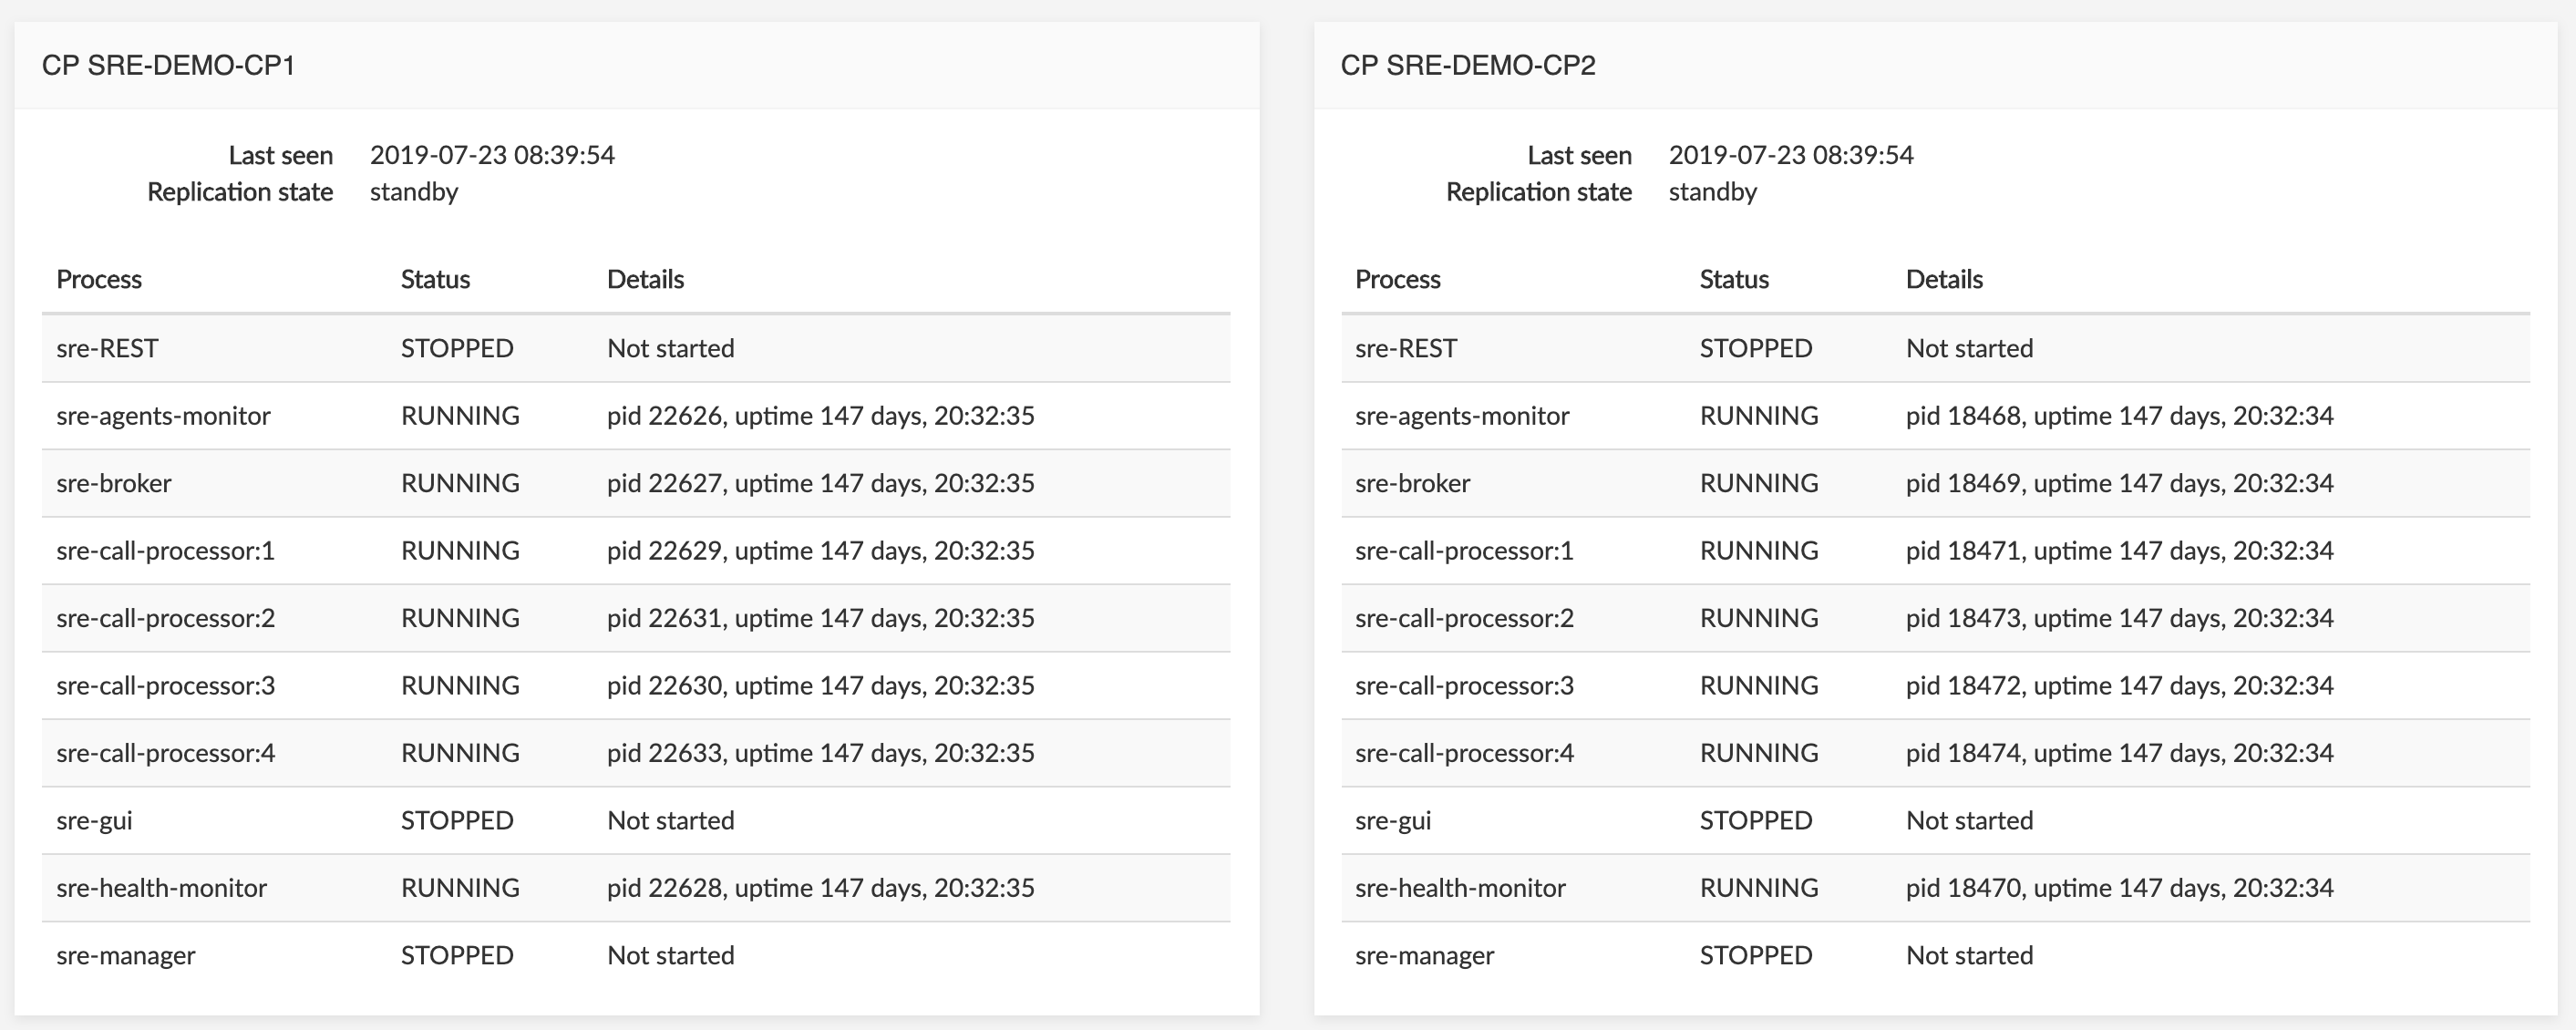
All processes listed in the configuration file of the watchdog (called supervisor.d) responsible for launching them are listed with Status (RUNNING / STOPPED) and details: the processid of the process and its uptime.
Some processes are inactive, depending on the server: there is no reason to launch a sre-call-processor or sre-broker process on an Element Manager server; similarly, a sre-gui process is useless on a Call Processing server.
Management processes are launched on Element Manager servers:
sre-managerandsre-guiare the most used ones. Other processes are launched depending on configuration and operations: for example,sre-RESTwill be launched if the REST API is needed for provisioning.- The
sre-health-monitorprocess must be launched on every server (EMs and CPs), because it is responsible for providing thesre-guiwith the information about the replication status of the DB and the processes status.
On the CP servers:
- Several instances of the
sre-call-processorare launched for performance and load balancing, equal to the number of CPUs or cores present on the server. - The
sre-brokeris the main interface between Kamailio and thesre-call-processorprocesses. The sre-agents-monitorprocess is responsible for sending SIP OPTIONS messages towards various SIP servers (configured in the SIP Agents tab, see SIP Agents below, or through Custom Probing, see SLE Manual).
If a process crashes, it is automatically restarted (by the supervisor.d): a small uptime usually indicates that the process has been restarted recently (for example, see in the picture above, top left, the sre-gui process on EM-SRE-DEMO-EM1 with an uptime of 67 days compared to 147 or 129 days for other processes on the same server).
All servers permanently notify the Element Managers that they are up. This information is shown in Last seen <date> <timestamp> below the server label.
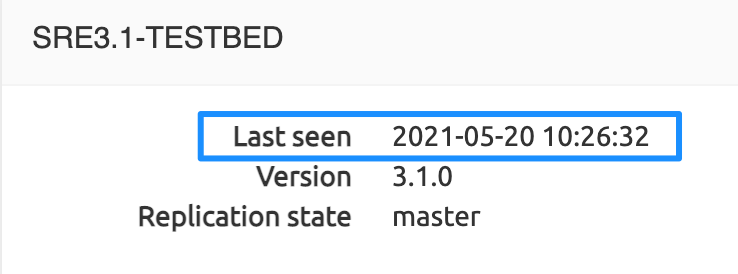
The Replication state (master/standby) indicates the status of the DB of the given server. One DB is the master for the whole SRE system, meaning that the master DB tables are directly replicated to each standby DB server. This is not a cascading replication but a direct one.
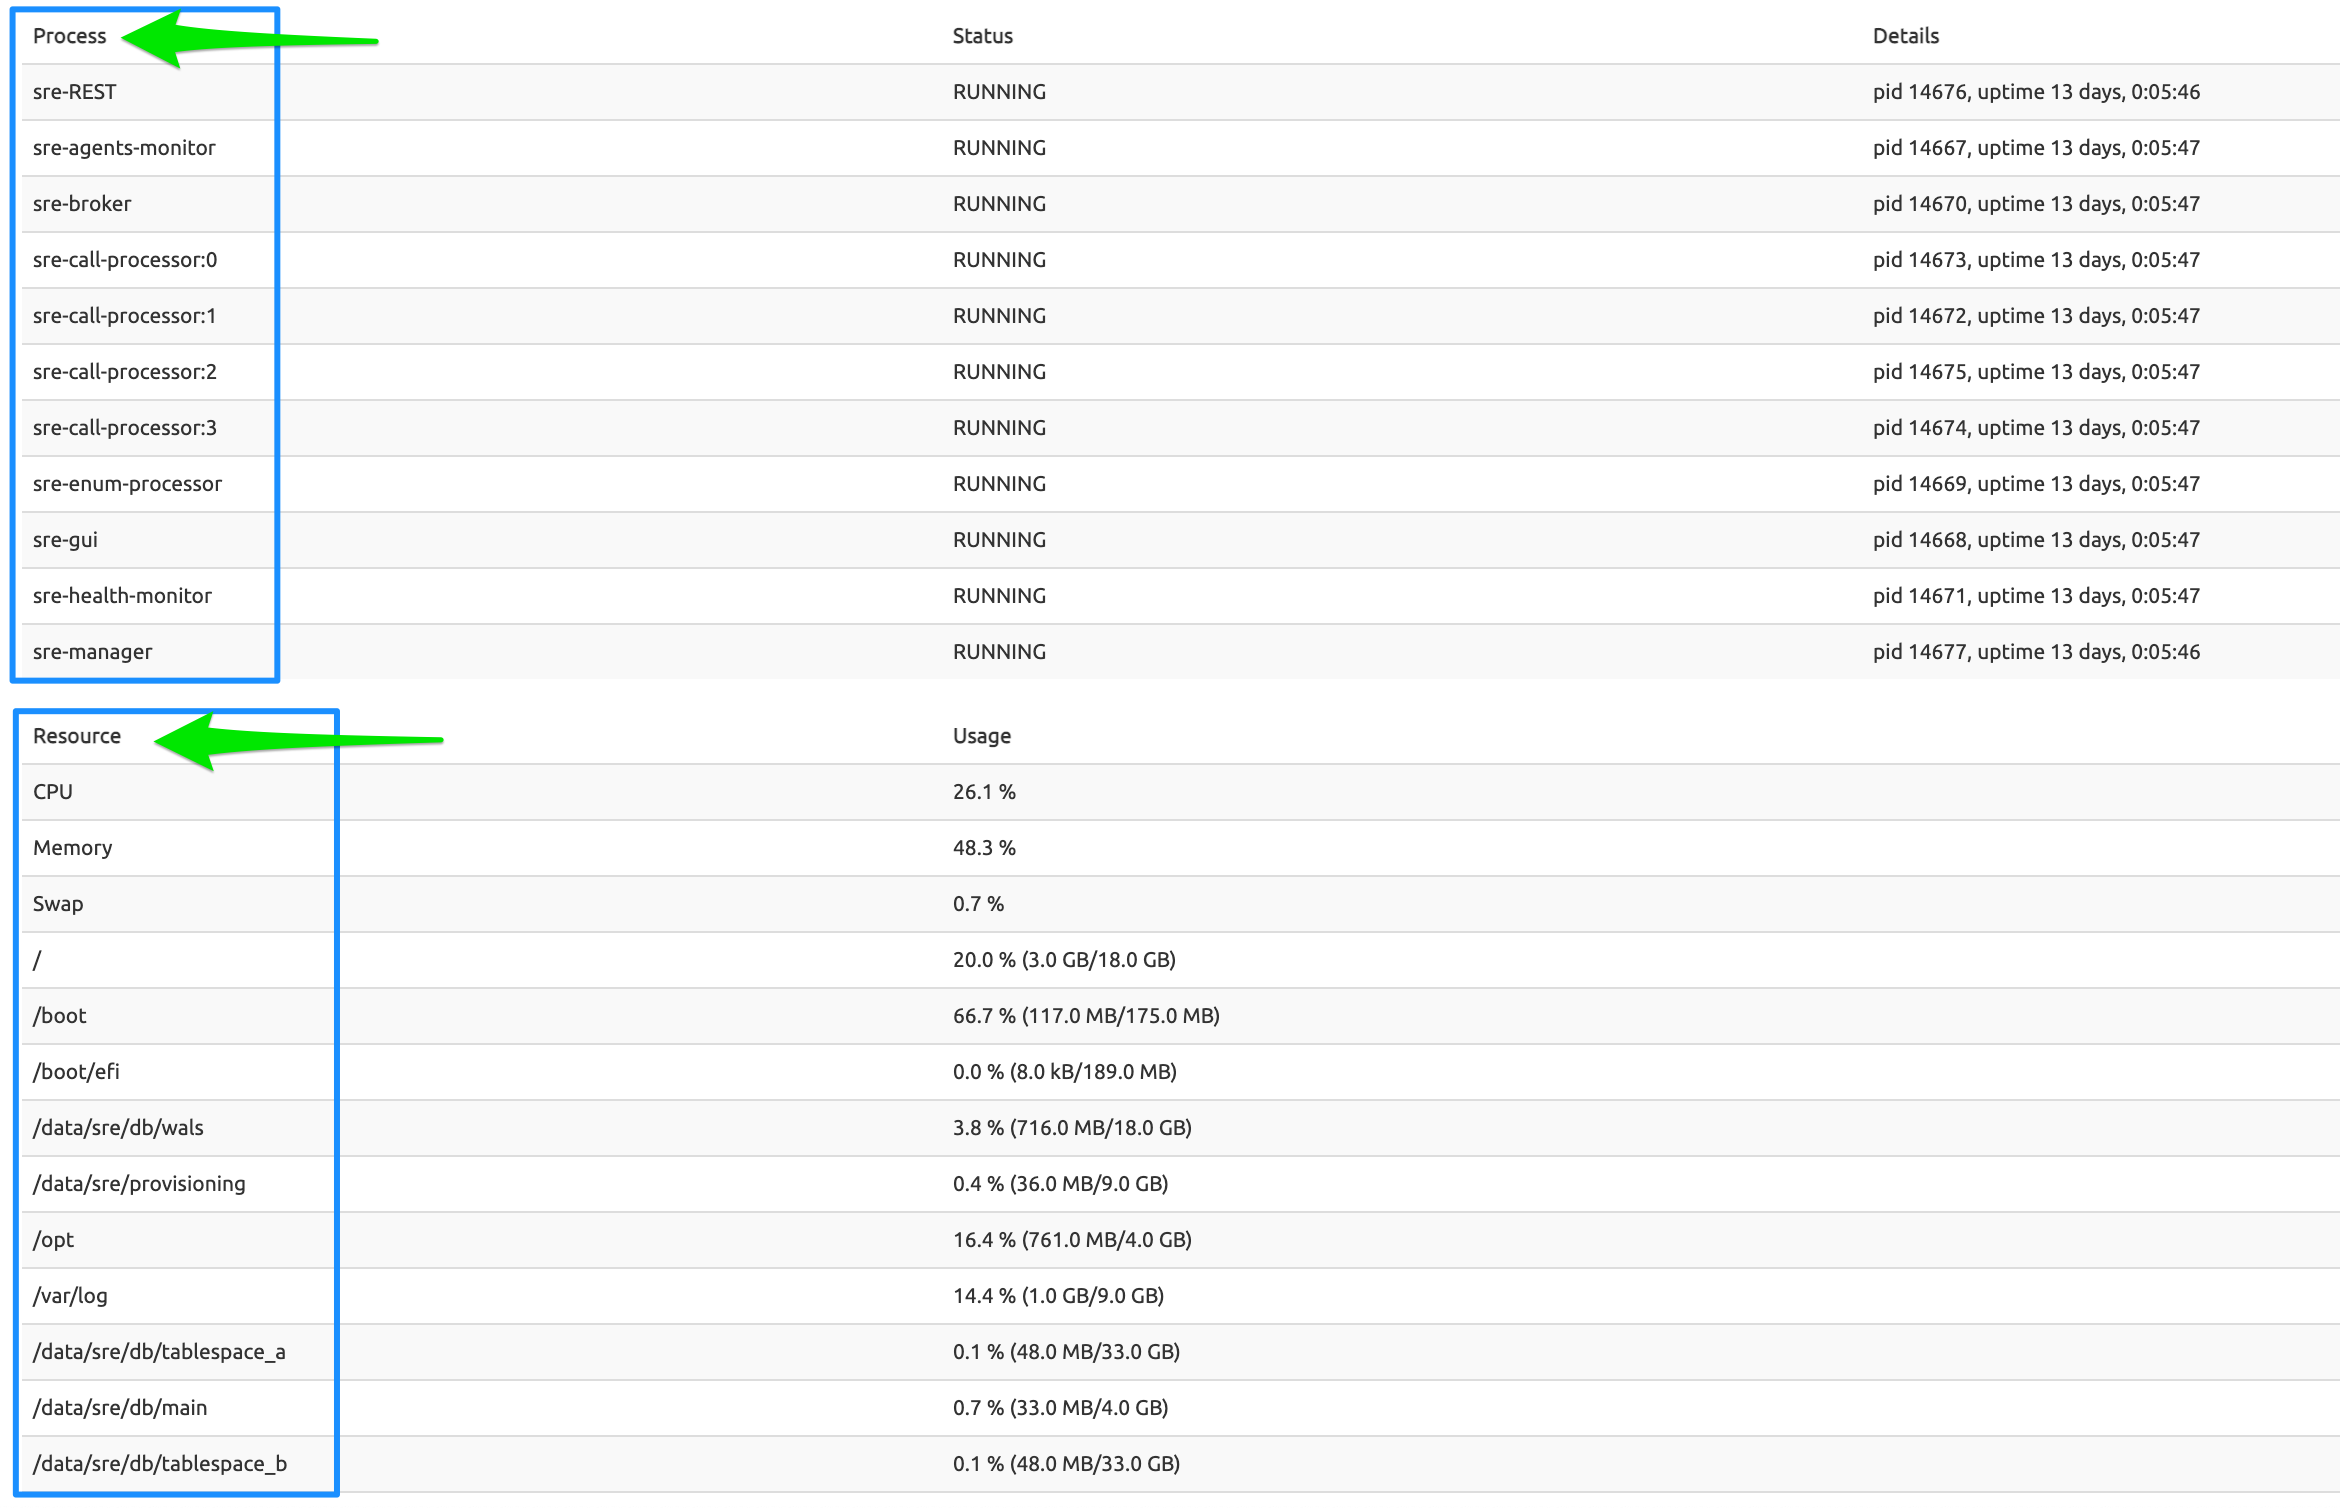
The System Overview tab also displays, under the Process section, a Resource section (second arrow in the picture below) showing standard information about the usage of the Operating System (OS) resources for each EM or CP server: CPU, Memory, Swap and the size and free space of the configured filesystems (/, /boot...).
Databases
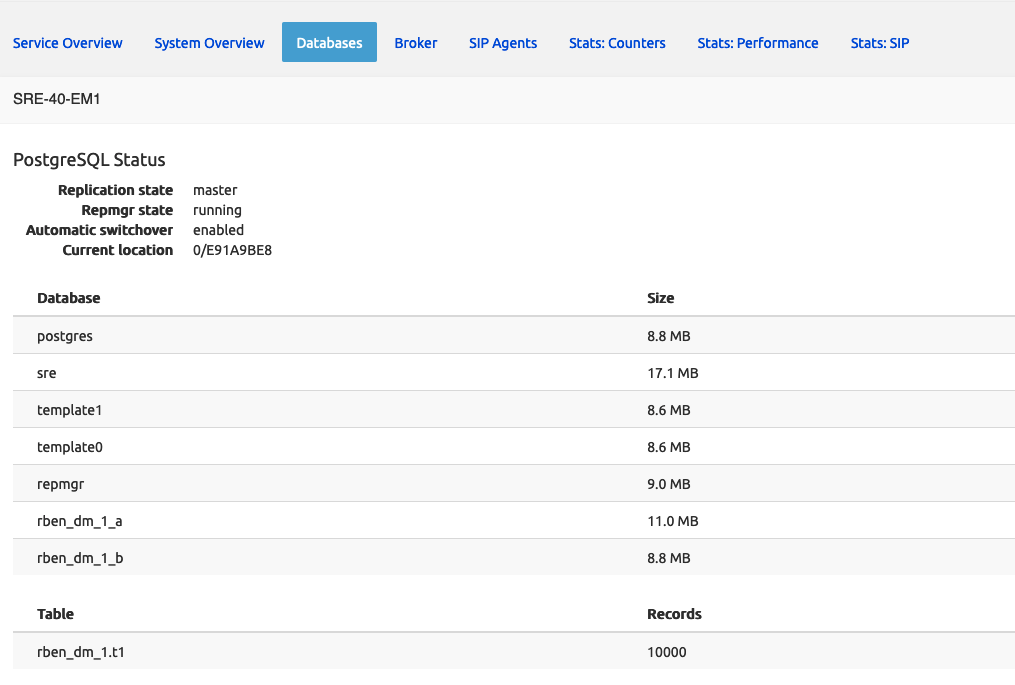
The databases contain a write-ahead log, which stores all operations that have been done on the DB tables. This log is what is replicated from the master DB server towards the DB standby servers.
The log has a position identifier (shown as Current location under Replication state in the picture below for the master DB server, as Last received/replay location for the standby DB servers). The Last received location value should be equal to Current location ; and the Last replay location should be equal to Last receive location, because the replication process replays the operations as fast as it receives them.
The Last transaction lag is the delta between now and the last timestamp associated with the location identifier. This corresponds to the last write operation done on the platform, which can get to a high value if the last changes in the user's table did not occur recently.
The Repmgr state shows if the daemon for automatic failover is running on this node.
The Automatic switchover shows if automatic failover of database is enabled.
The table below shows the size of the DBs. Each service has two versions of its DB, one suffixed with _a, the other with _b. For more information, see Data Versioning below.
INFO
Databases in the list that have NO suffix _a or _b are system databases used by the SRE. Databases with the _a and _b suffixes are service databases used by various service logics.
Broker
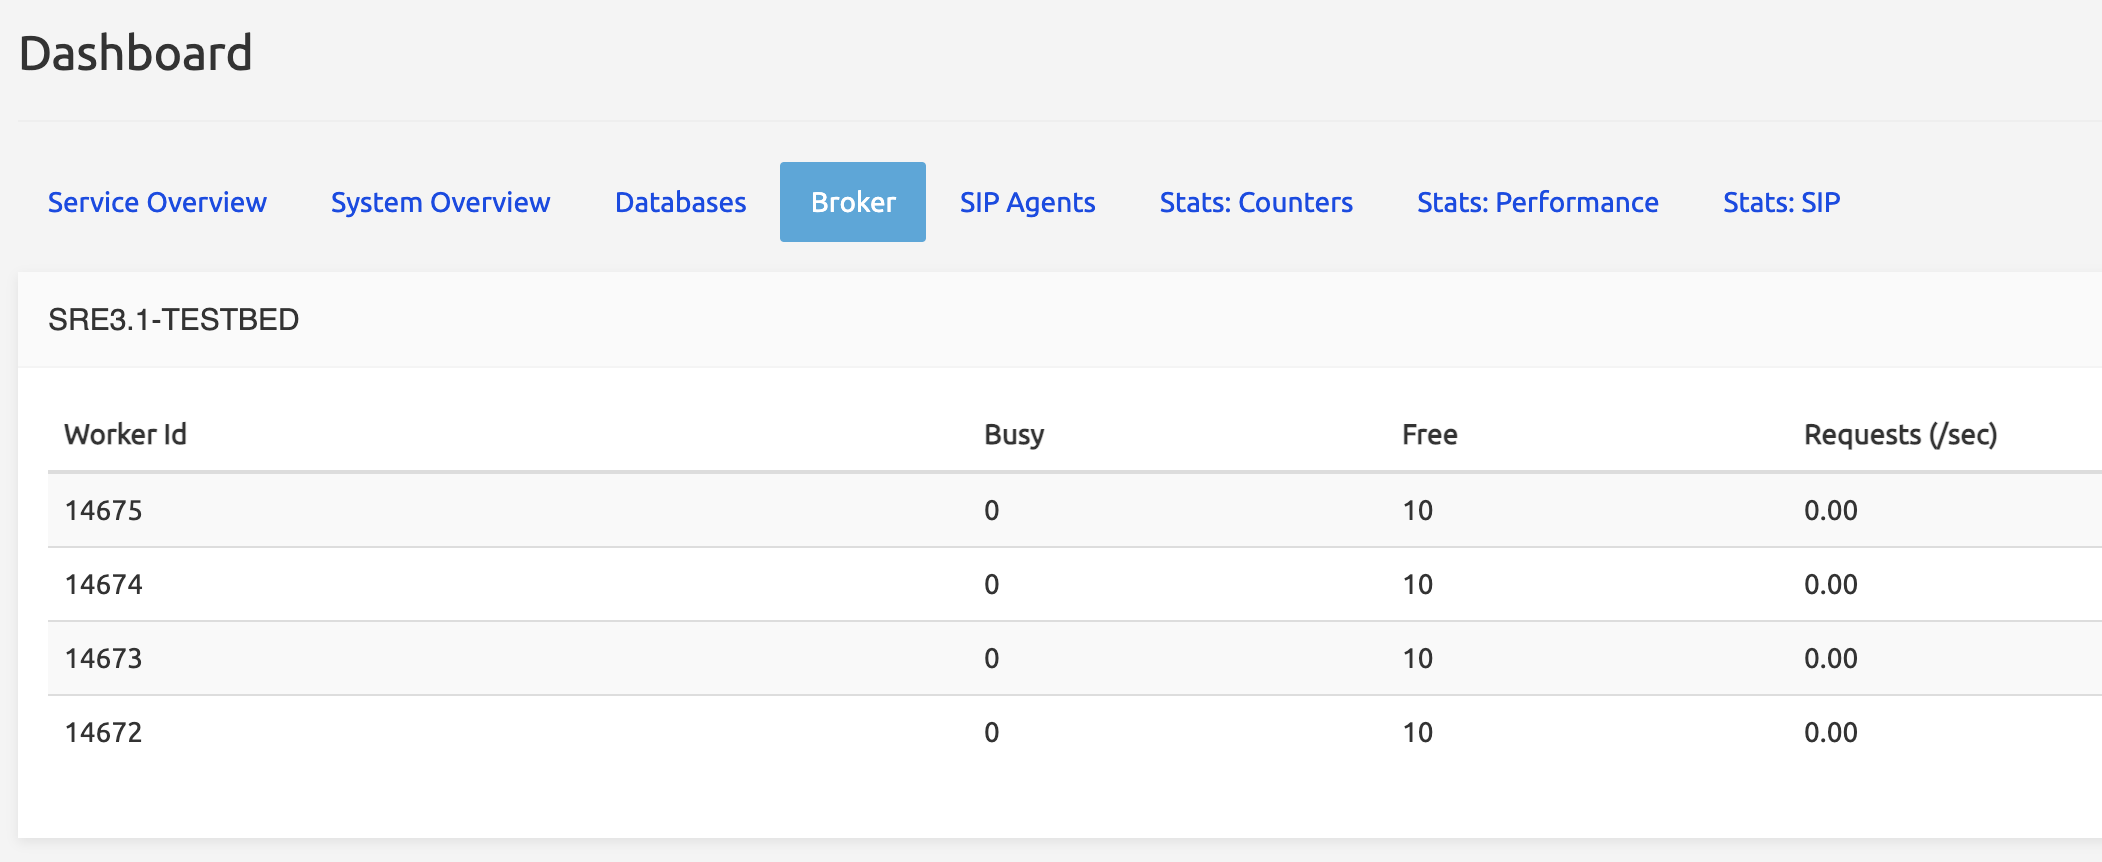
The Broker is the process (sre-broker) responsible for ensuring communication between Kamailio and the Call Processors (sre-call-processor:n running on the CPs). Both Kamailio and sre-call-processors register with the sre-broker, which connects them together.
The (running) sre-call-processor:n processes are identified here as Workers ; the Worker Ids displayed are the pids shown in the Overview tab.
Each process has 10 threads: the Busy and Free columns show how many threads are available (40 per CP node over 4 processes, depending on the number of CPUs or cores, see above).
A load-balancing mechanism spreads the requests received from Kamailio over the processes.
SIP Agents
SIP Agents are controlled by the probing feature of the SRE through the sre-agents-monitor processes running on the EM and CP nodes. The process sends SIP OPTIONS messages to the IP Address of the listed SIP Agent (at a frequency defined in System / Settings / SIP Agents Monitoring, by default 60 seconds).
The SIP Agents tab lists the SIP Agents configured in System / SIP Agents Monitoring (see SIP Agents Monitoring) and provides their information (Address, Port, Transport) and Status.
Depending on the answer received from the SIP Agent, 3 statuses can be reported:
TRYING: OPTIONS message has been sent but no answer has been received: the status is not yet known. This might indicate that the SIP Agent is down.
UP: OPTIONS message has been sent and a positive answer has been received. The SIP Agent is up and running.
DOWN: OPTIONS message has been sent and an error message (like 500 or 503) has been received. The SIP Agent is down.
CONFIG MISSING: Source addresses for probing are not configured in System->Settings->Sip Agents Monitoring.

Stats:Counters
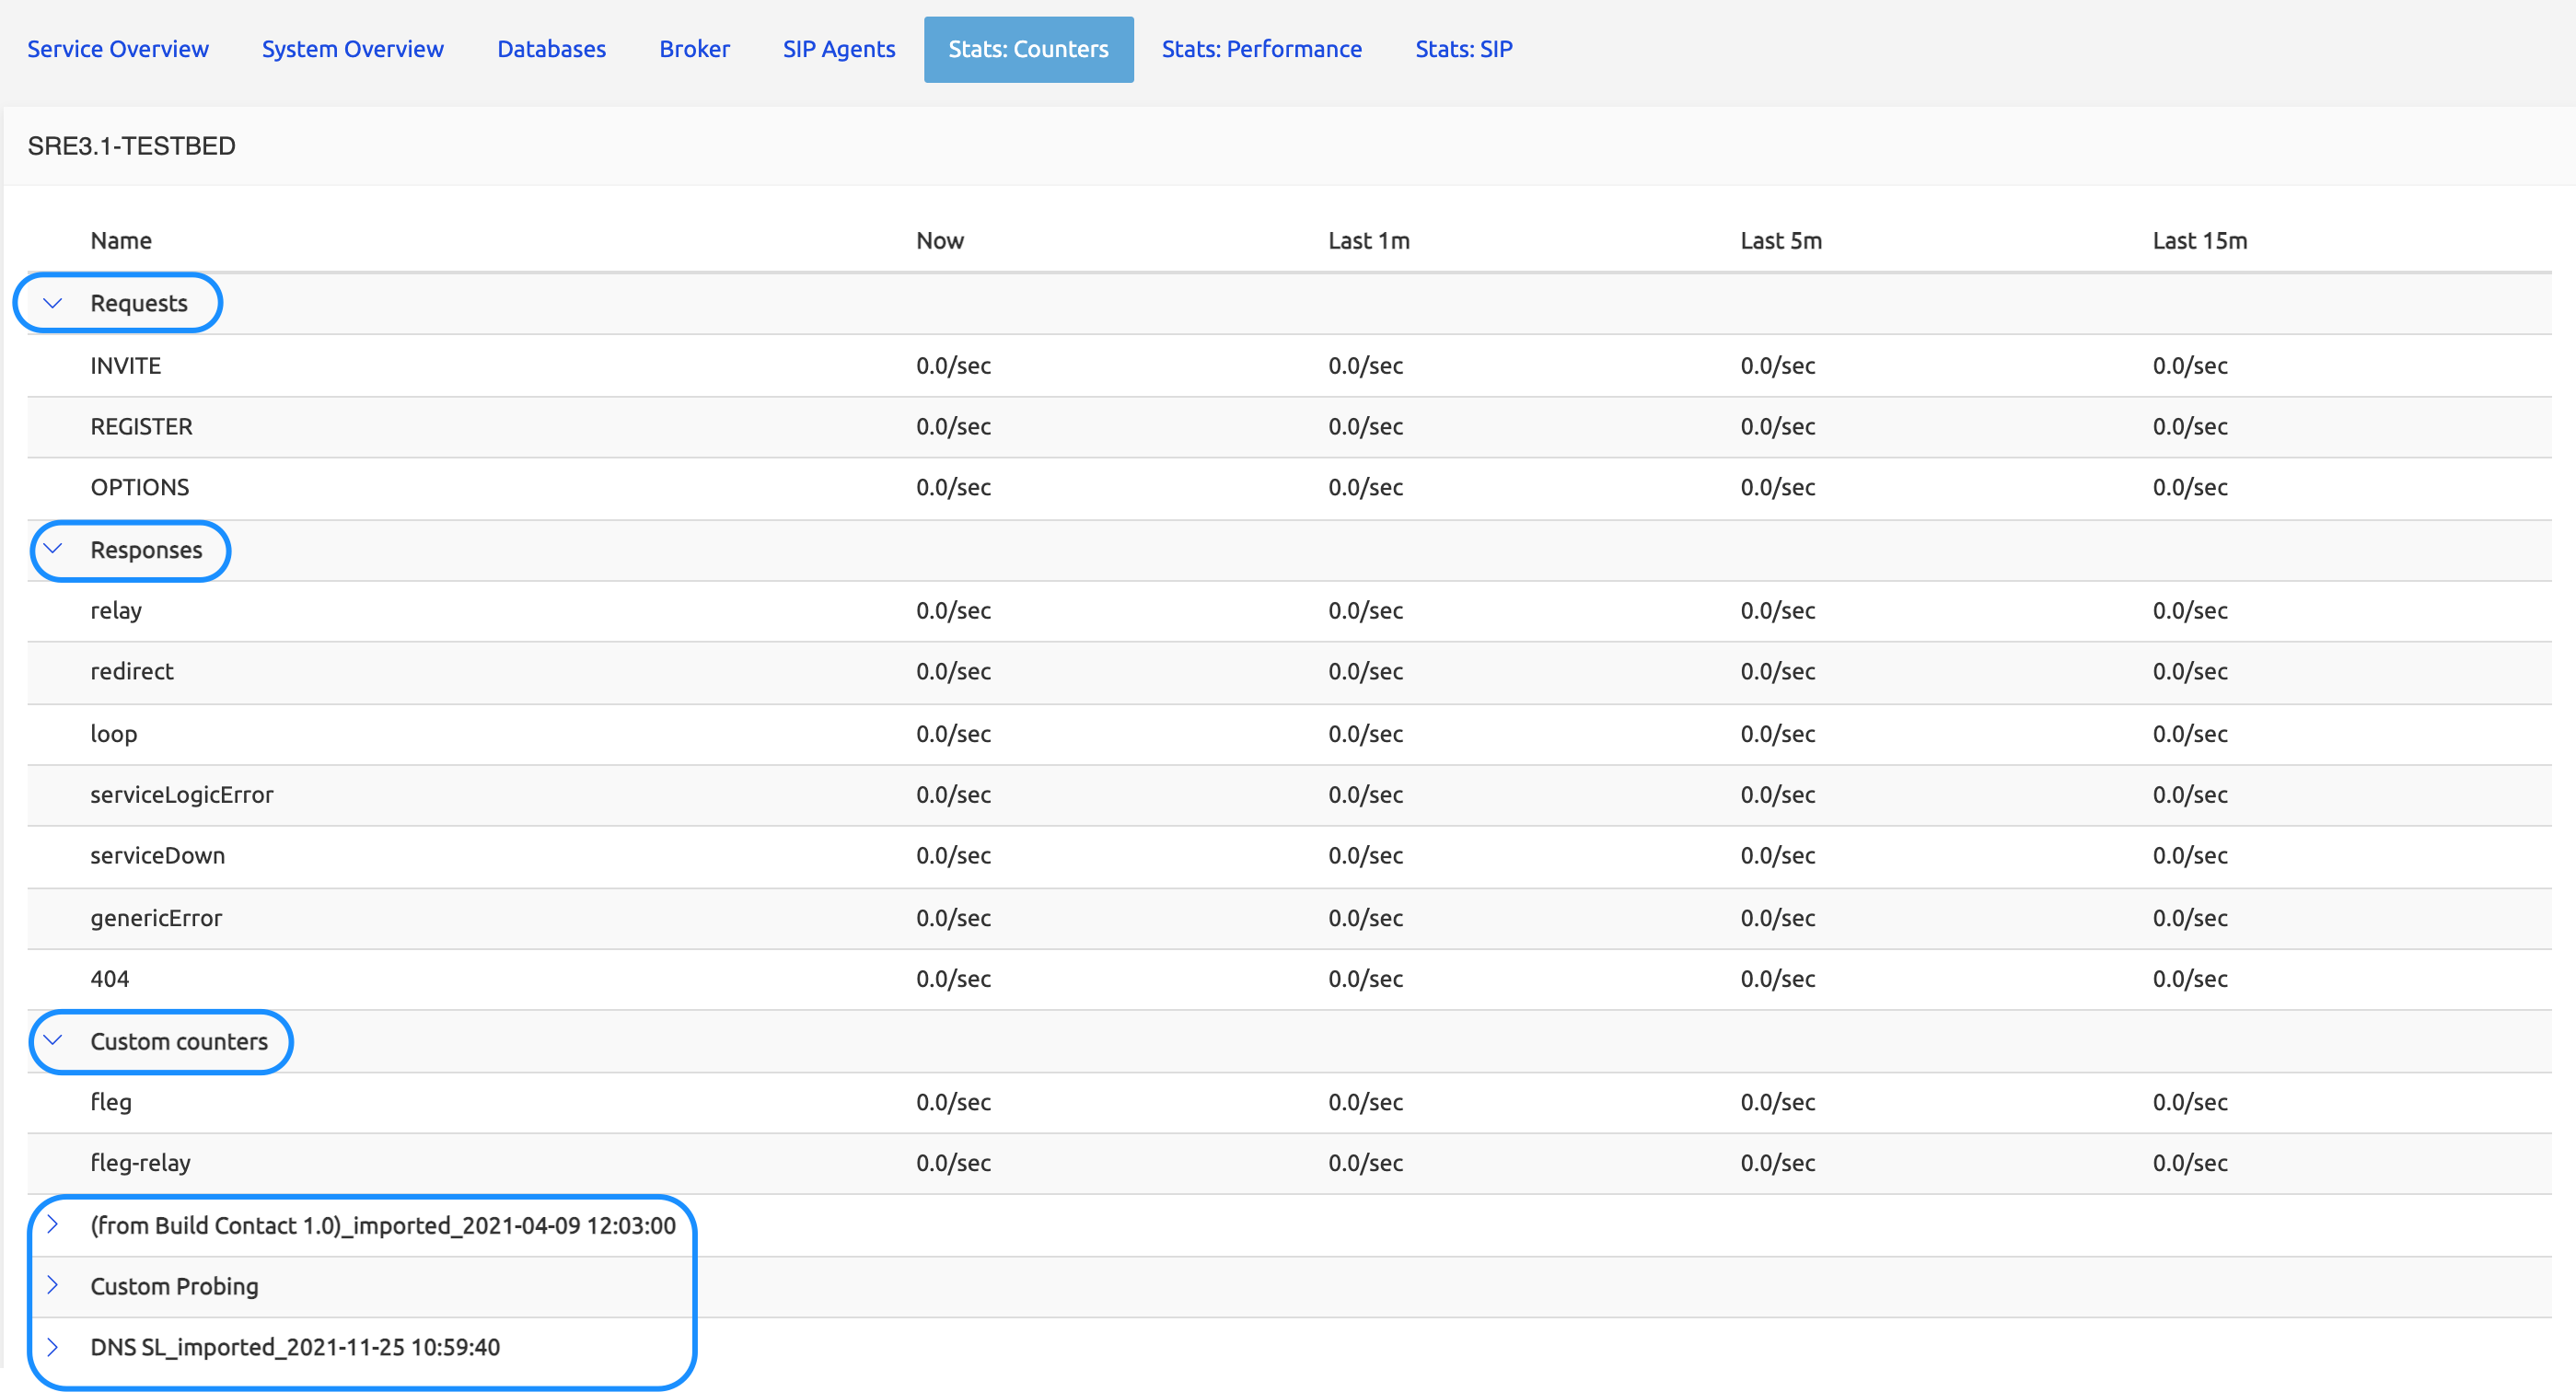
The Stats:Counters tab shows values for generic counters (request. and response. ) and for custom metrics and service-specific counters (<service_name>.<service_node>) of the currently activated service logics.
The values are grouped under category labels shown circled below. Only the CP nodes are shown here, as the EM nodes don't process calls.
Requests and Responses categories are by default open (that is, showing all the corresponding rows), while the others do not show the details of the sub-lines. Users have to click the > sign on the left in each category to display the rows.
Generic counters:
Requests and Response counters show values for the standard operations of any service: INVITE, REGISTER or OPTIONS requests, redirect and loop responses, and error messages like Service Down, Service Logic Error etc.
Custom Metrics:
New category showing Custom Counters with metrics defined through a specific SL node called Increment Custom Counters)
SL and sub-SL metrics
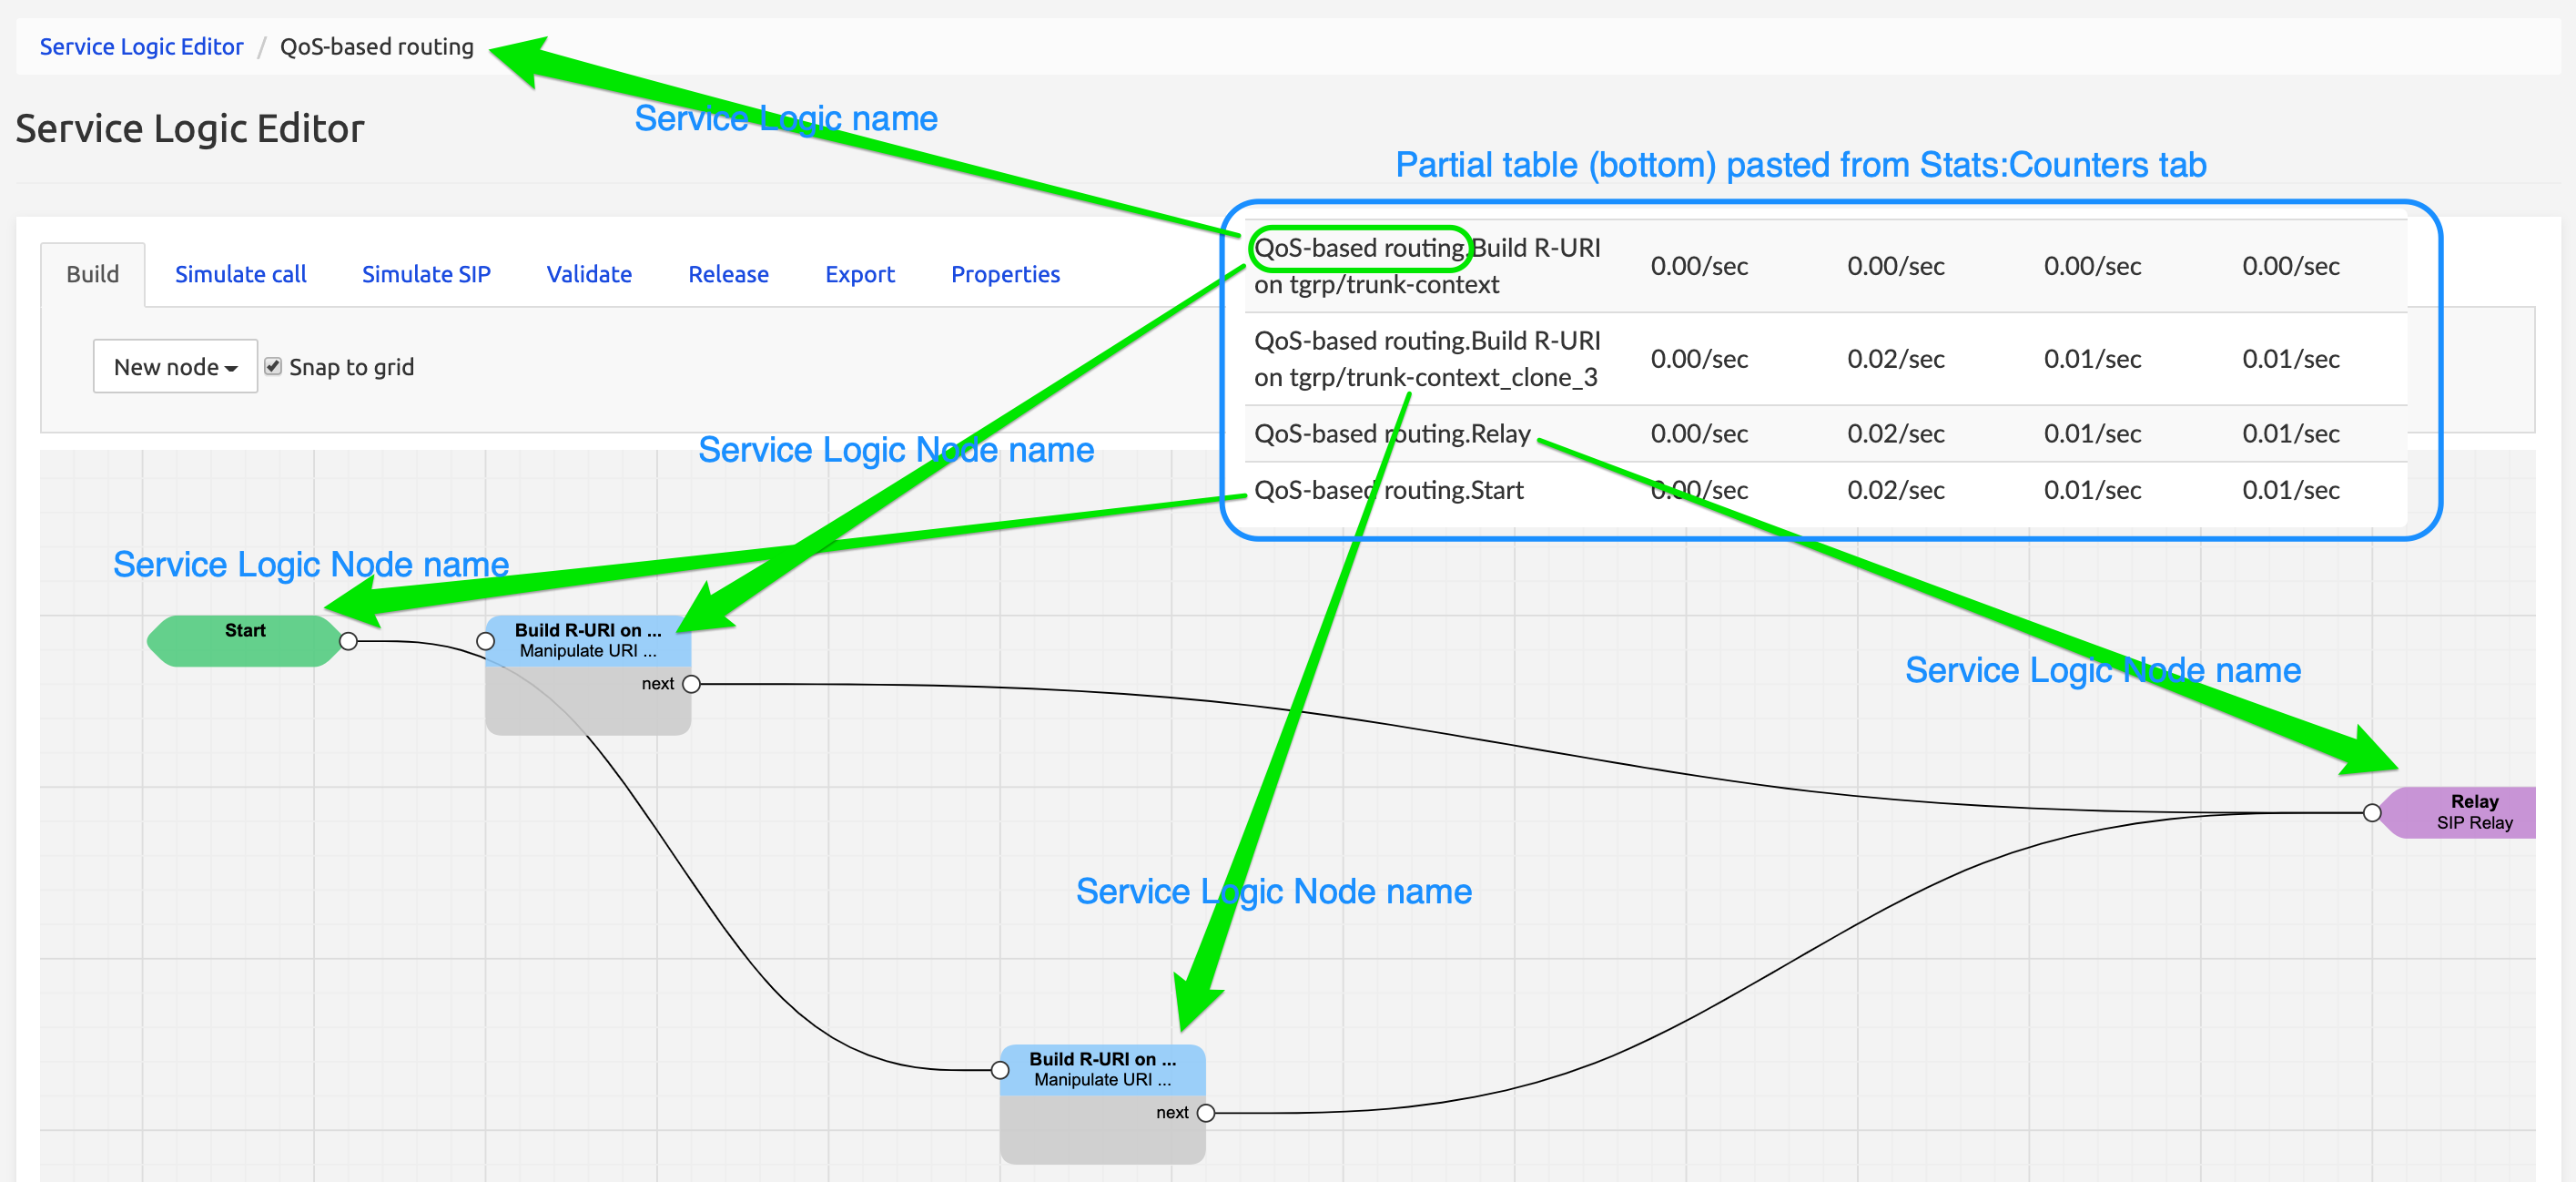
Service Specific Counters:
The picture below shows the Service Logic Editor GUI (see separate document Service Logic Editor Guide) with QoS-based routing service opened. This service logic has four nodes: Start, Relay, and two Build R-URI nodes. The counters corresponding to these nodes are shown in Stats:Counters tab, and in the partial table on the right (blue frame), pasted from Stats:Counters.
Durations:
The counters show the mean number of operations during the last 15 minutes, last 5 minutes, last minute and Now, being last 10 seconds (this 10-second window allows computing a more significant mean than the one which would result from a one-second measurement).
For Custom Metrics, as well as for the existing metrics, the measures are up until 15 mins back and in terms of counts/second.
Stats: Performance
The Stats:Performance tab shows, for the same generic operations and service-specific nodes, the performance value, i.e. the duration needed to complete an operation from its start to its end. This allows, for example, analyzing the performance of a given node in a service logic.
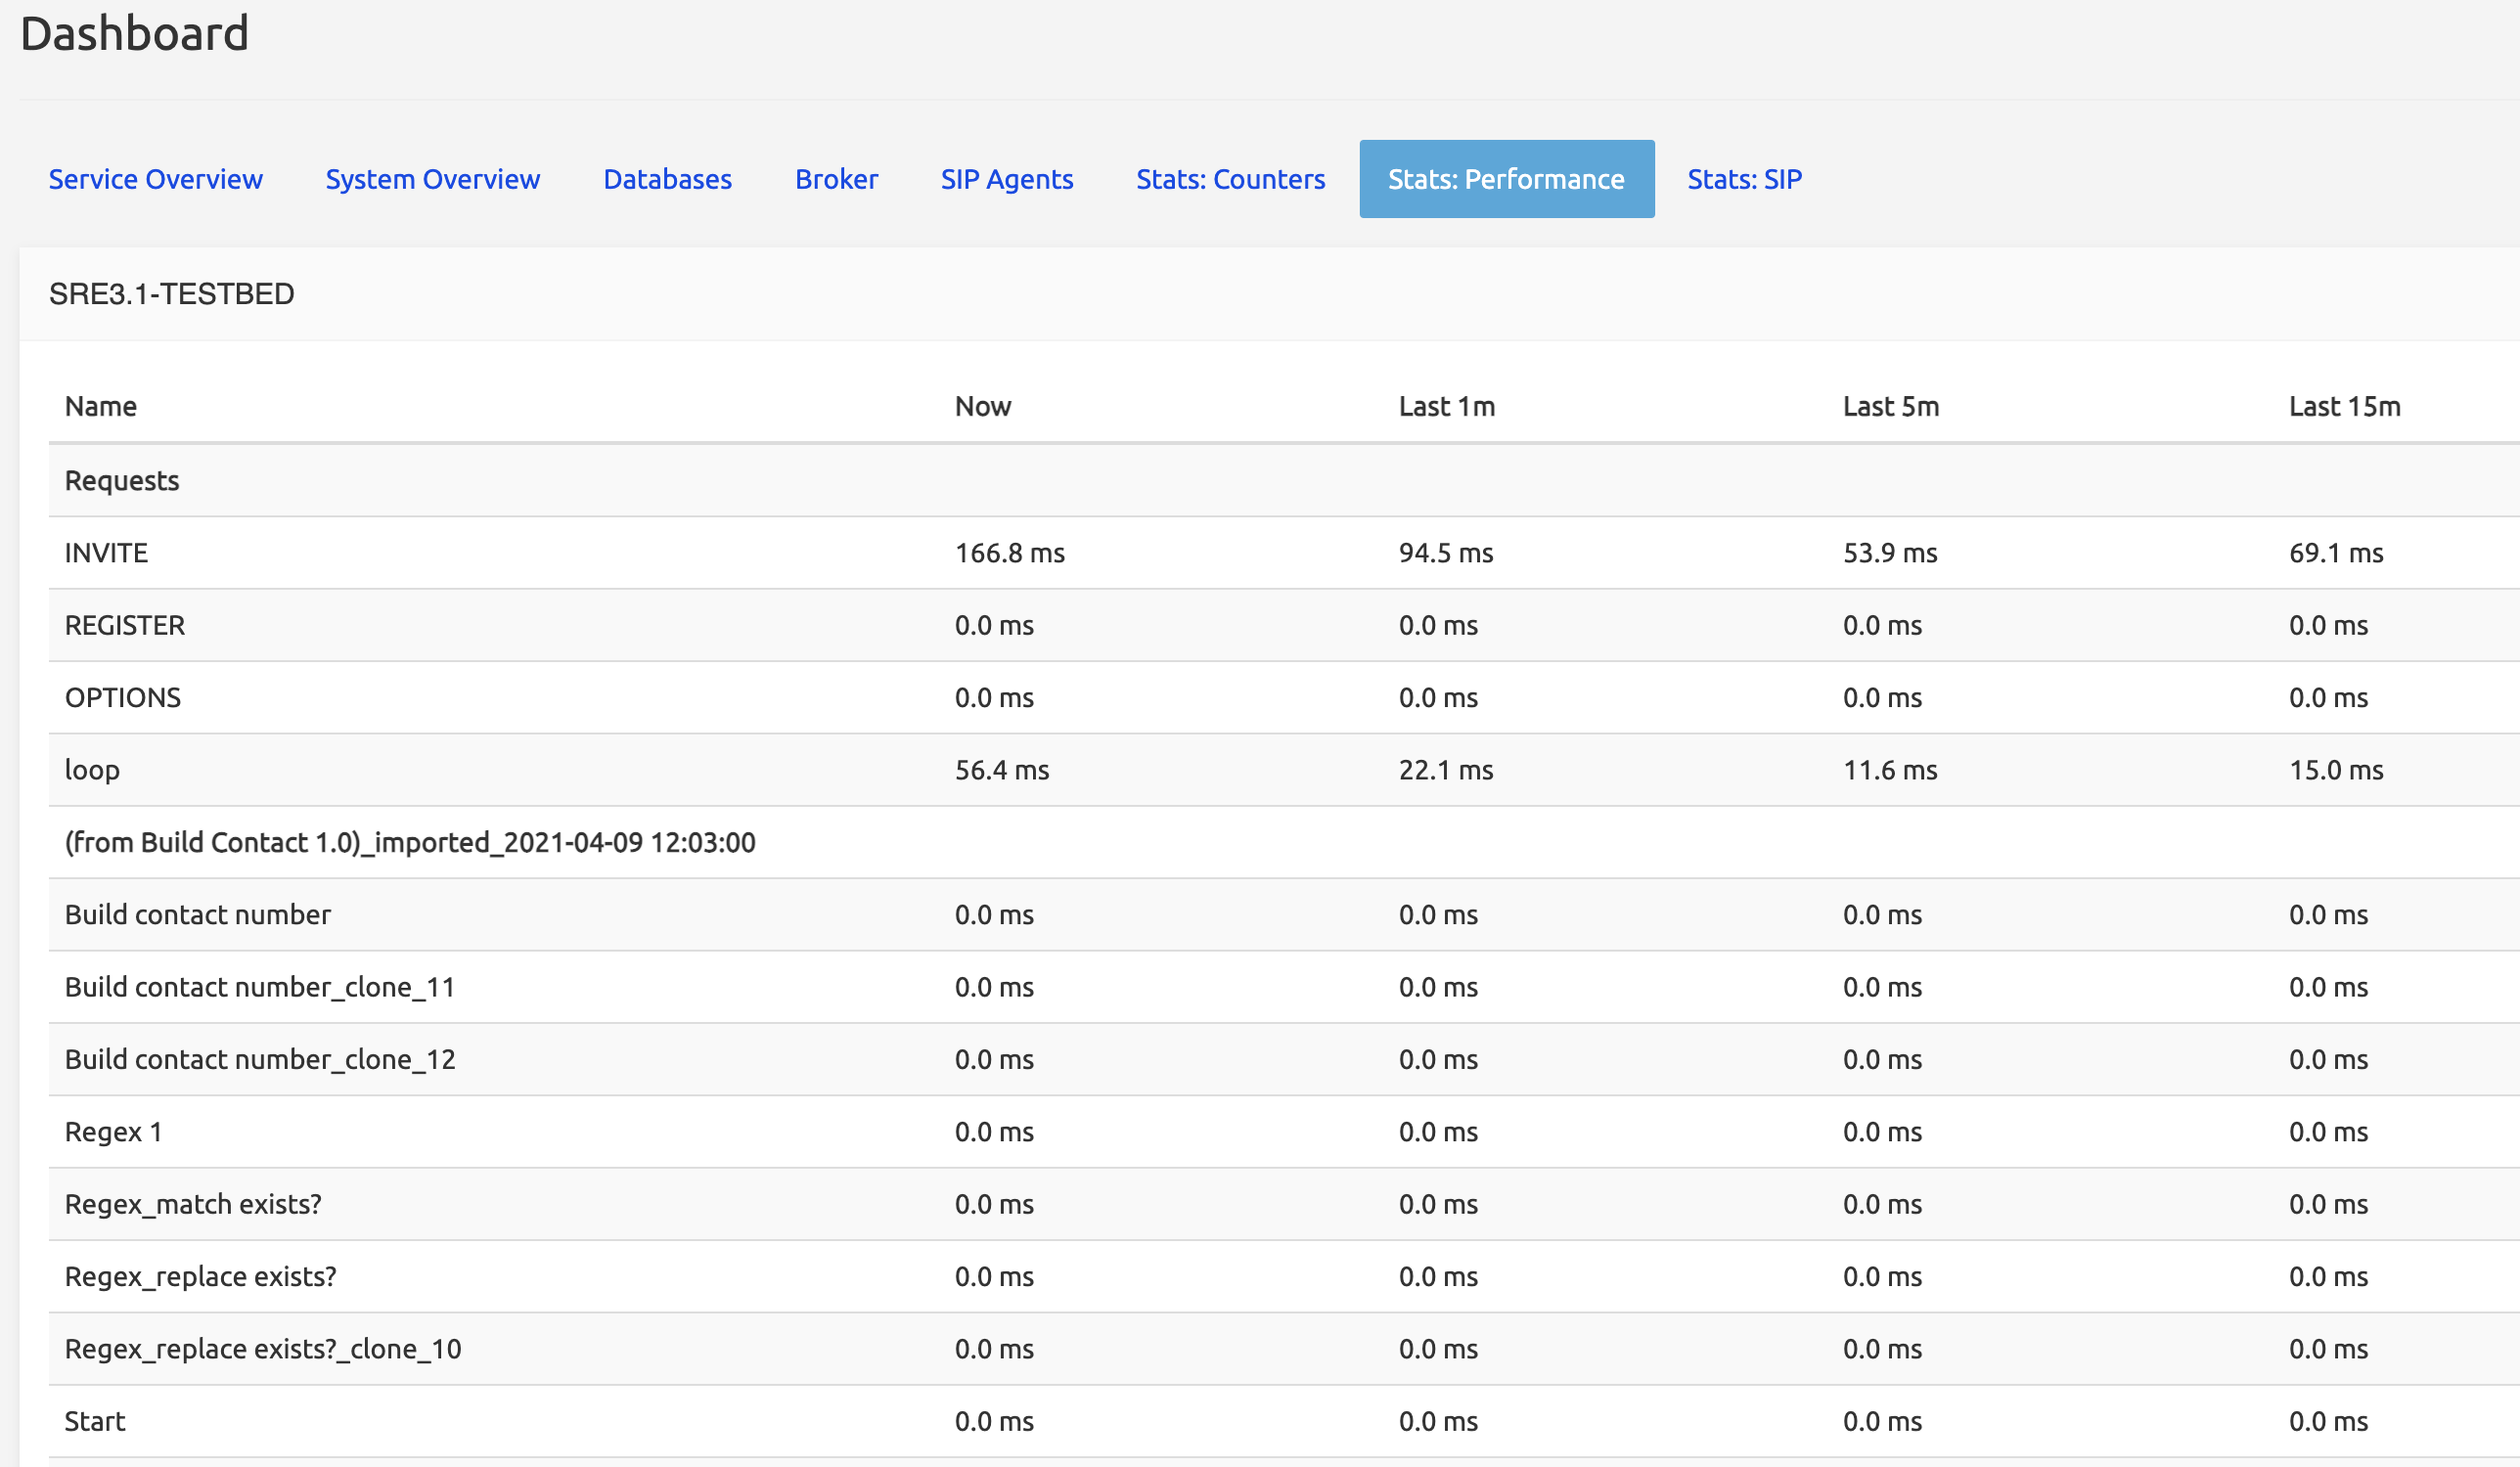
Stats: SIP
The Stats:SIP tab shows Kamailio's internal raw statistics as sent to SRE.
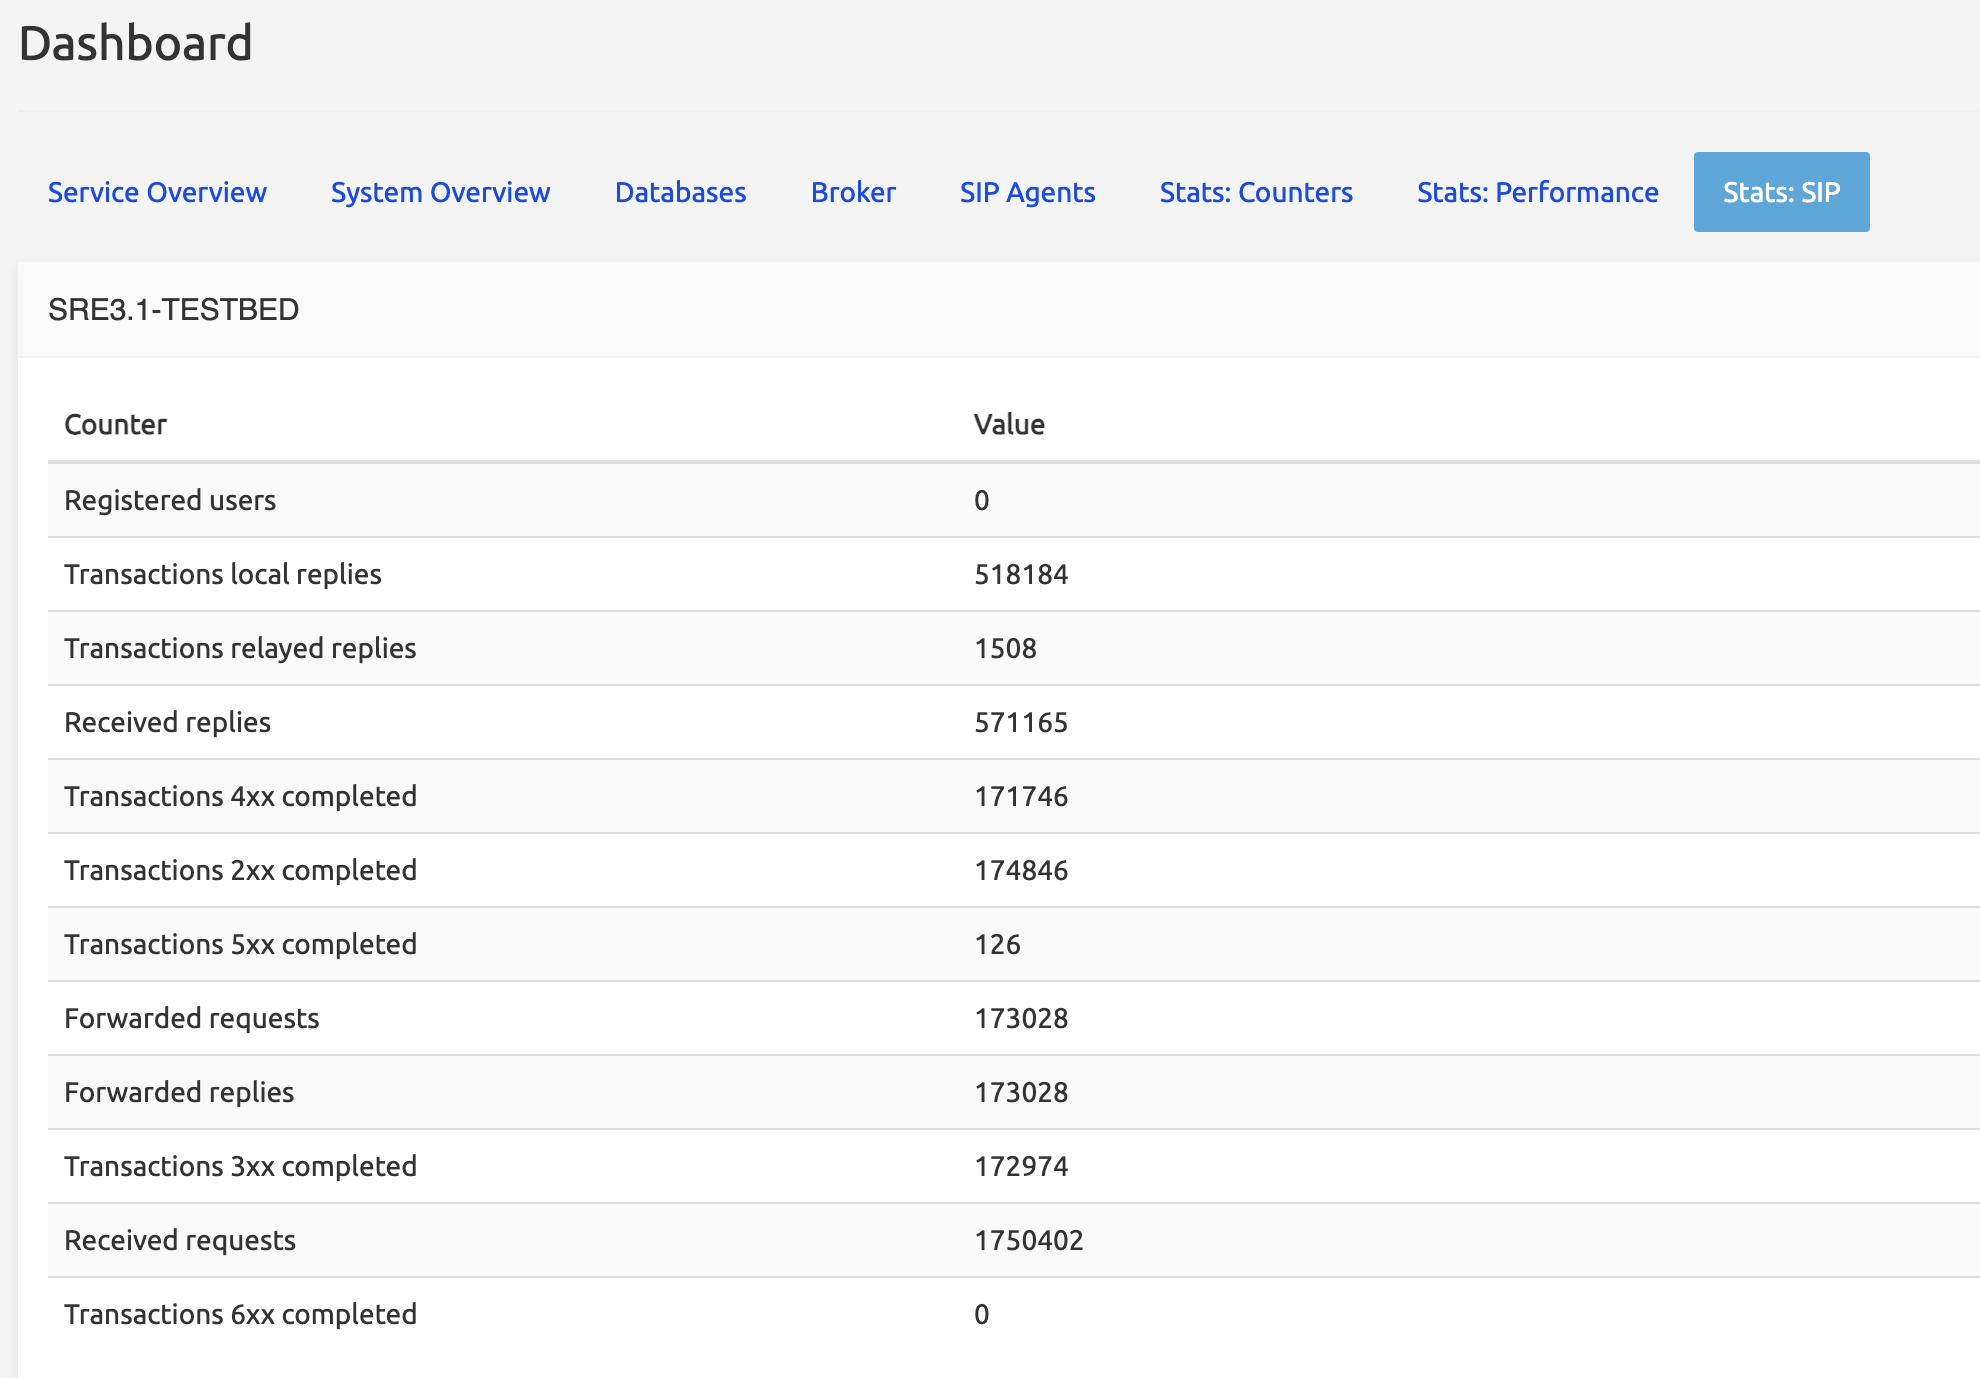
- Registered users is the number of users registered if the REGISTRAR function has been used.
- Transactions local replies is the number of transactions where the reply remains local. Ex.: Kamailio receives an OPTIONS message from an SBC asking the status of a SIP Agent; it asks the SRE (SIP Agents tab) about the status; the
sre-agents-monitorprocess checks the status and tells Kamailio to answer « 200 OK ». This is a local reply: no other messages have been exchanged between Kamailio and the SRE. - Transactions relayed replies are the number of transactions that are relayed from Kamailio to a final destination. This number is roughly equal to Forwarded requests above.
- Received replies is the number of answers Kamailio received from an external system.
- Transactions Nxx completed is the number of transactions completed with a class 200, 300, 400... answer (200 OK being typical for calls)
- Forwarded requests is the number of requests sent to an external system (ex.: an INVITE request).
- Forwarded replies is the number of replies Kamailio has forwarded to the originating source.
- Received requests is the number of requests received by Kamailio.
Data Administration
The SRE uses service logic to provide answers to queries from the network, for example, to manage the routing of a call. Service logic is based on a service made of tables, which store the data needed to perform the desired call routing. The services and their tables are created and edited with the Datamodel module.
The Data Administration menu, auto-generated by the active version of the services' datamodels, present the tables grouped by service, as defined at implementation time or later edited using the Datamodel module. The tables can be accessed through this Data Administration menu to manage the data in the tables (create, edit, import or export, delete records).
INFO
The databases, called services in SRE terminology, and the tables they are made of, are visible in the Data Administration menu or in System / Data Versioning / Versions Comparison. They work in conjunction but must not be confused with the various service logics implementing the routing, visible in Service Logic / Service [Logic] Selection.
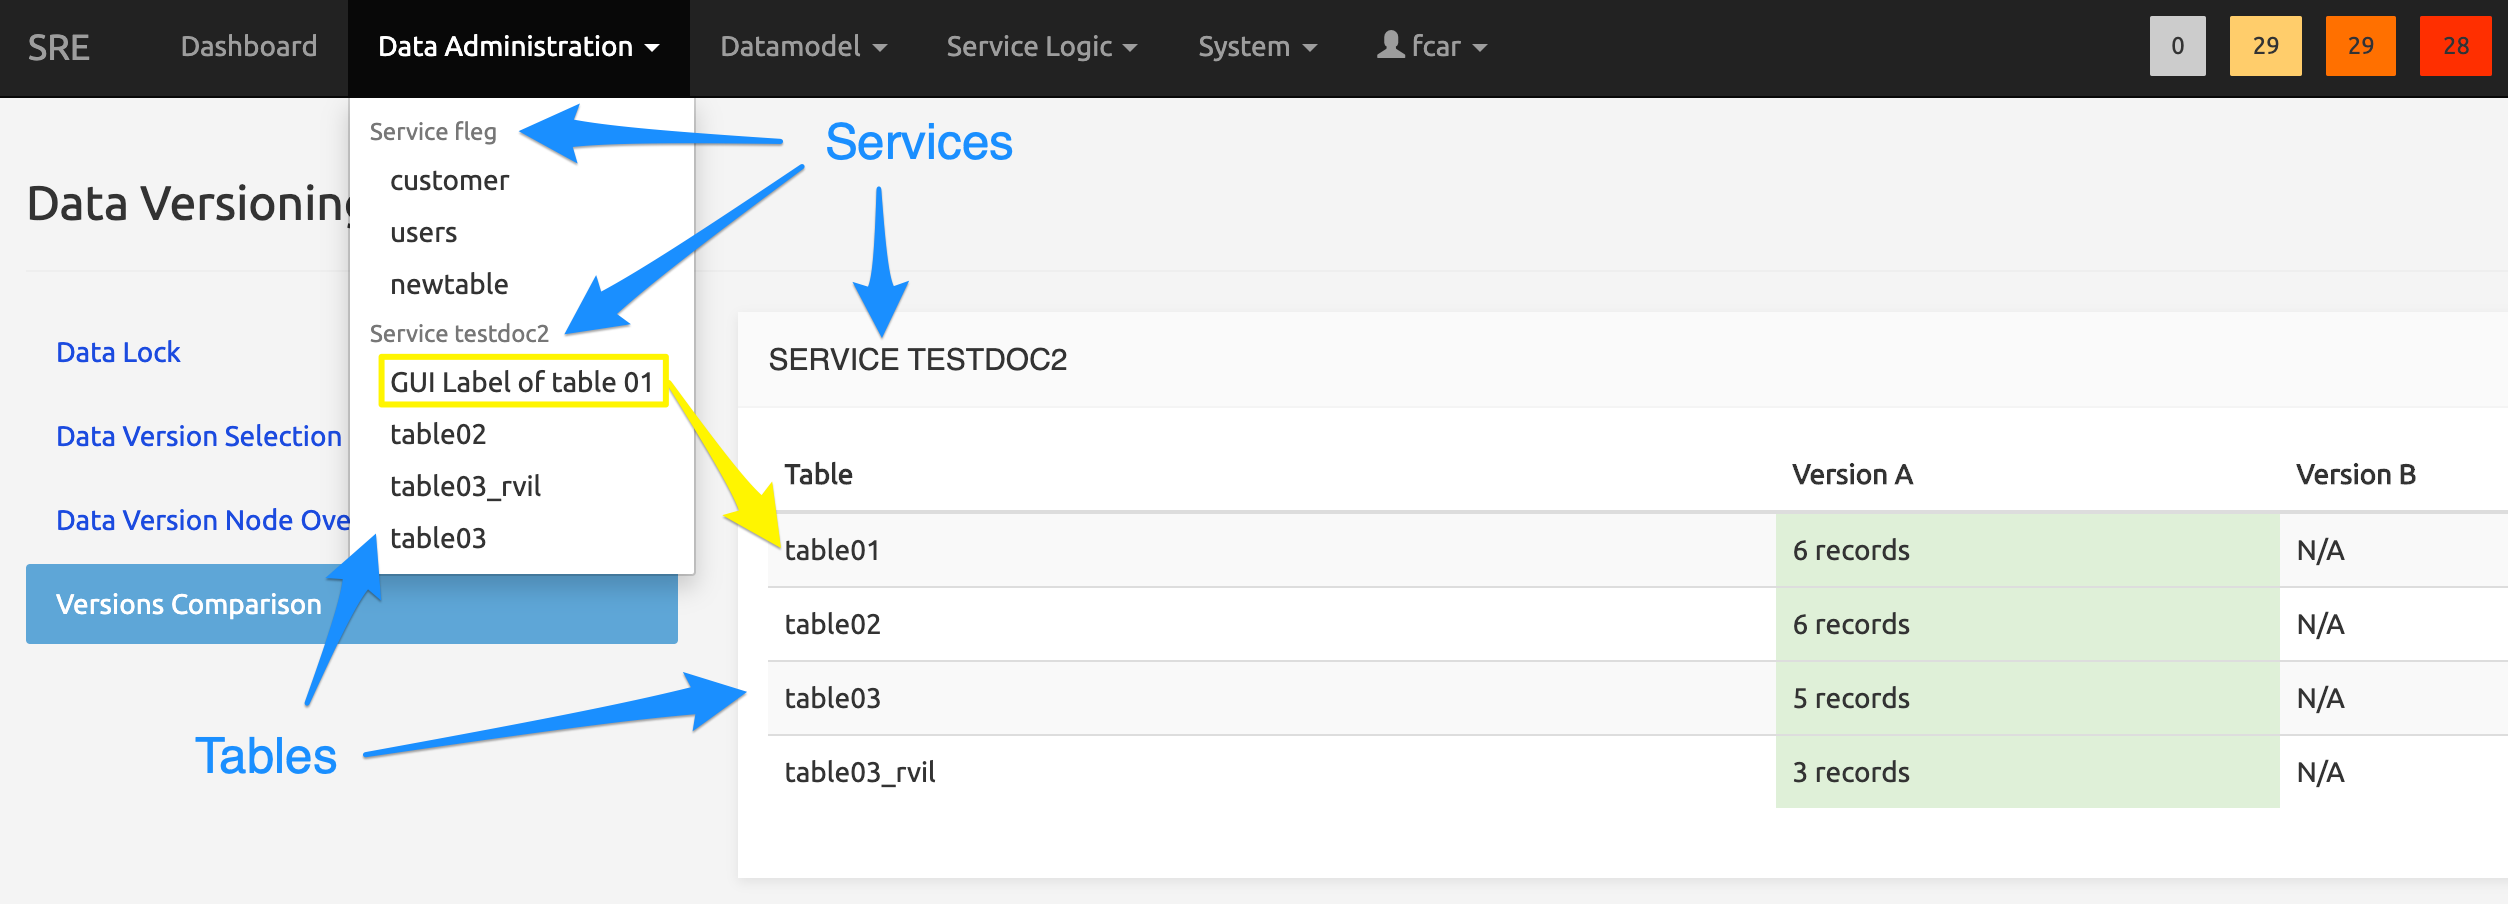
The picture below shows an example of how the Data Administration menu may look: it depends on the access rights granted in the role of the connected user (see Roles tab). Services are shown in grey (and are not selectable); tables are shown in black. The background of the picture shows the Data Versioning / Versions Comparison page, where ALL services and their tables are listed (unlike in the Data Administration menu, where only the services that the user has access to are listed).
Note that table01 of service testdoc2 is listed in the Data Administration menu as GUI Label of table 01 while its system name is indeed table01. This is because a GUI Label has been specified for this table in the Display property of the table in the Datamodel Editor main form.
Managing records
When selected in the Data Administration menu, each table is presented on a page illustrated below.
The Search part at the top presents a search form based on several criteria (the columns of the table), treated as a logical "AND". The search is case-sensitive.
The Export results to CSV button on the right provides the possibility to export the records filtered by the Search action to a CSV file.

The export is done through a job (a pop-up is shown indicating it, a click on the warning will lead to the System>Jobs menu).

The Results of the Search operation (the matching records found) are displayed below in a paginated results table (limited to 1000 entries). The table presents the data organized in columns as defined (and possibly friendly-labelled) in the Datamodel Editor
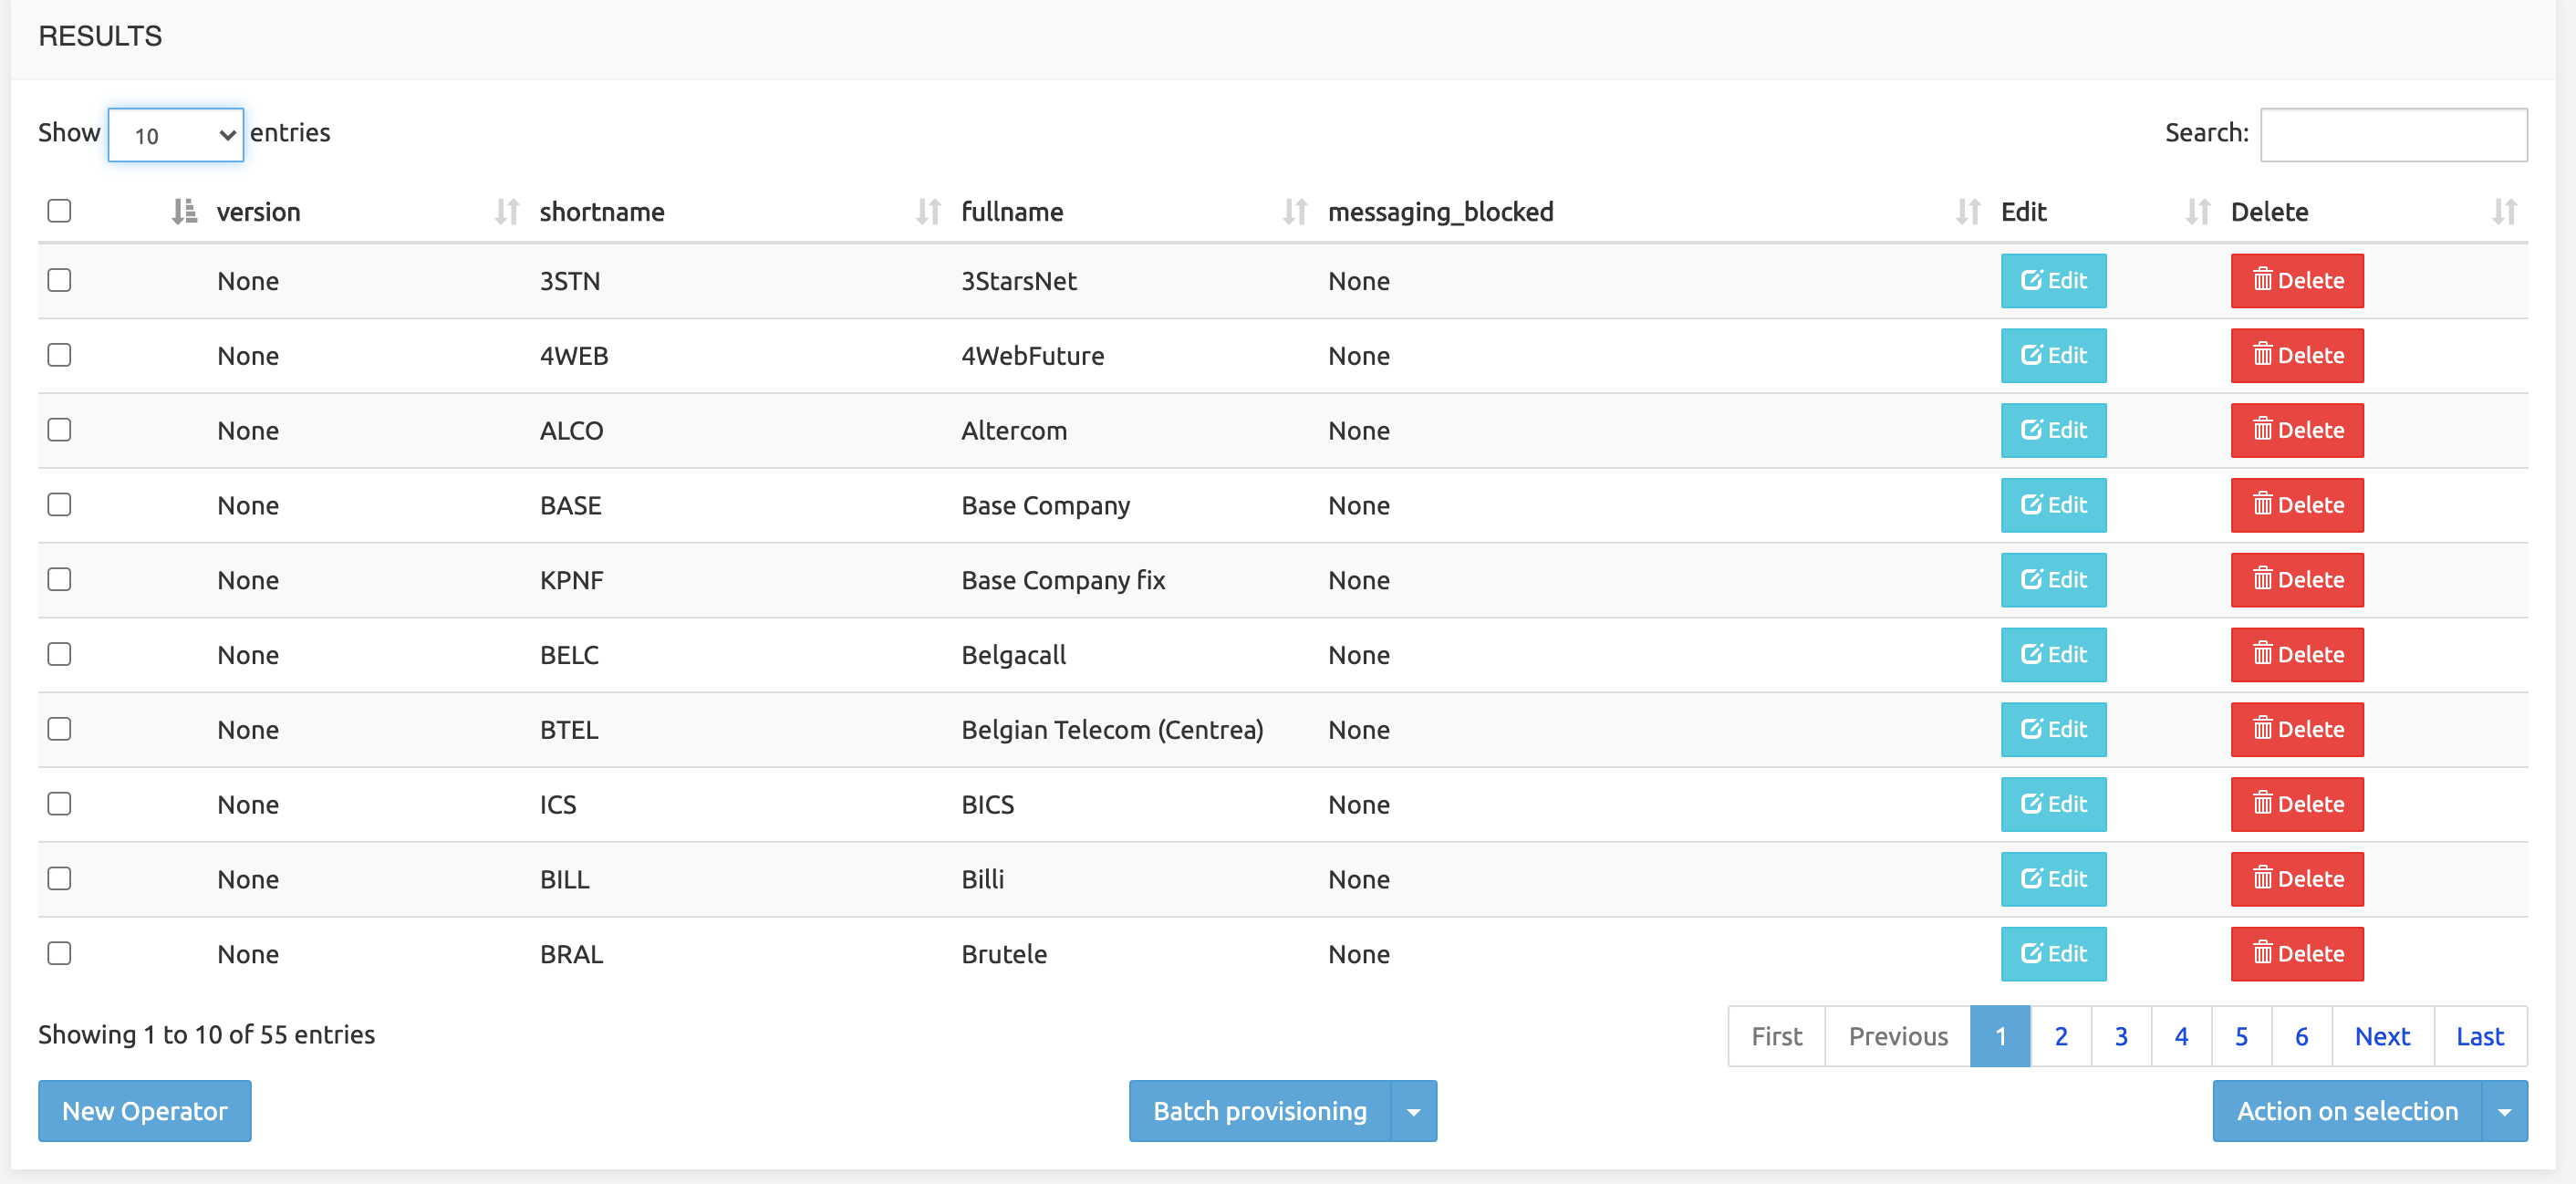
On each record's row, Edit and Delete buttons are available to respectively edit the record or remove it from the table.
The Edit button has a drop-down arrow. When clicked, it presents a Clone option allowing to clone the current record into a new one, keeping the existing data and allowing to modify them.
The Search field at the top right allows filtering the results list by any string (digits or characters or both).
Operations on data
Record creation
The New ... button (bottom left) opens a New Record form allowing to create a record by filling in the fields relevant to that specific table. Validators may have been implemented to ensure that the input matches the data type (see Datamodel Editor, Validators).
INFO
If one or more fields are nullable, at the record creation phase, the form proposes to mark an empty field as Null (checkbox "set to NULL"). If the check is selected, the field will be written as NULL. If it is not checked and the field is left empty, the record will have that field as empty (but indeed existing). This is of importance when using, for example, the operator "exists/does not exist" in the condition type nodes in a service logic.
Batch provisioning
Three options allow for import, export or remove batch operations. Each operation and their conditions must have been defined in the Datamodel Editor, see CSV Import and Export to CSV.
Import from CSV: select a valid CSV file to import. If the Erase all checkbox is checked, the existing data are dropped and the imported data are committed to DB only after the full import process has ended successfully. If not, existing data are preserved and no imported data are inserted.
Disable updates flag: fully prevents a batch import whenever any of the records in the csv file match the unique keys of any existing record in the target db table.
Access the System/Jobs list (or open it by clicking on the « Import job has started » message) to see the results of the import action (see also Jobs).
In case of failure, double-click the Job information line in the System/Jobs list: it opens a Details window which can help understand why the import has failed. A usual case is a column declared with one type (example: integer) and getting import data of other type (example: text).
Export to CSV: exports all table data to a CSV file, stored on the SRE server. It can be accessed and downloaded locally using the System / Jobs list (see Jobs.
Double-click the Job information line in the System/Jobs list: it opens a Details window showing the export operations.
Remove from CSV: deletes all records matching the unique criteria, as defined in the Import section. In case a csv line matches several records in the database table, the operation is aborted, as batch provisioning is considered a transactional operation.
The result of a remove action is visible in the Jobs list.
Action on selection
The checkbox on the left on each row allows selecting multiple rows, which can be edited or deleted using the Action on selection list button (bottom right).
Edit action shows a sub-page with columns and selection boxes. All records in the selection will take the value(s) typed for the selected column(s).
Delete action deletes (with confirmation) the selected records.
Datamodel
SRE 3.0 introduces a new module called Datamodel. This module allows SRE Administrators to create or edit services, with their tables, indexes, constraints and import/export facilities. A versioning system takes care of the datamodel development history. Datamodel versions can be activated, edited, exported, and rolled back through backup-restore.
The SRE uses service logic to provide answers to queries from the network, for example, to manage the routing of a call. Service logic is based on a service made of tables, which store the data needed to perform the desired call routing. The services and their tables are created and edited with the Datamodel module.
The Data Administration menu, auto-generated by the active version of the services' datamodels, present the tables grouped by service, as defined at implementation time or later edited using the Datamodel module. The tables can be accessed through this Data Administration menu to manage the data in the tables (create, edit, import or export, delete records).
INFO
The databases, called services in SRE terminology, and the tables they are made of, are visible in the Data Administration menu or in System / Data Versioning / Versions Comparison. They work in conjunction but must not be confused with the various service logics implementing the routing, visible in Service Logic / Service [Logic] Selection.
Datamodel Editor
Selecting Datamodel Editor in the Datamodel menu opens the LIST page displaying all services already created in the system.
List of services
Each row in the list shows a service, each having 4 action buttons: Edit - Open - Import - Delete (see below).
Users only granted a read-only role can only open a service. The 3 other action buttons are inactive for such users.

At the bottom left, the New Service button allows opening a Record creation page to add a service to the list.
Creating a service
Click New Service to open the New Record page. All you have to do is enter a service name. The service name must be lowercase, start with a character and can contain characters, digits or _. Click Save to proceed.
A service being made of tables, the Datamodel module opens the New table page, where you can define tables and their properties. See Datamodel Editor main form below.
You can also bypass for now table creation and get back to the LIST page, from where you can also start editing the active version of the datamodel of the newly created service.
Editing an existing service datamodel
On the LIST page, click an Edit button to edit the active version of the datamodel of the corresponding service. See Datamodel Editor main form below.
Importing a datamodel
On the LIST page, click an Import button to import a previously exported datamodel into the service listed on the row. The prior export operation happens in the Datamodel Versioning menu, see Datamodel Versioning, Exporting a datamodel definition below.
Select from your local system or a remote location a service datamodel file previously exported, provide any relevant information in the Description field and click Import (or Close to cancel the operation).
WARNING
Importing a service datamodel into another service merges any tables, conditions, GUI and import-export settings from the source datamodel into the target service. To avoid this merging and potential issues, one may want to import a service only into an empty new service, where nothing specific has been defined and where no data have been stored. A typical use case would be to develop a service on a development environment with many successive versions, then export the final version and import it into an empty service on a production environment. After import, the target service would have only one definition/version, the final one exported from the development environment.
WARNING
Importing a service datamodel only applies to the schema/design of the datamodel. The data from the source service are NOT imported. If needed, they have to be exported to CSV file(s) and imported into the target service.
Deleting a service
On the LIST page, click Delete to delete a service, its datamodel, tables, data and versioning history. An acknowledgement is displayed and must be checked for the deletion to be performed.
WARNING
As this removes every trace of the service from the SRE webserver environment, no rollback is possible from the SRE GUI. Please contact Netaxis Support team for guidance about how to backup and restore databases using CLI tools.
Datamodel Editor main form
After service creation or after clicking Edit on the LIST page, the Datamodel Editor page opens. It allows defining tables, columns, indexes, check conditions, and data import/export settings that belong to the service. It also allows saving a new version of the service datamodel. This new version is stored in the Datamodel Versioning system and will have to be activated for the changes to be operational.
WARNING
Editing an existing Datamodel adds items to it or modifies its existing items. These operations are expected to be saved (to a new version, see below Save New Datamodel Version).
If you quit the DatamodelEditor web page, your browser detects unsaved changes and displays a pop-up window asking for exit confirmation.
To edit a table, select it in the left panel, then navigate the sections on the main panel to set table elements and properties.
The screen below shows the main form with Table 1 selected on the left panel, and its columns in the main panel.
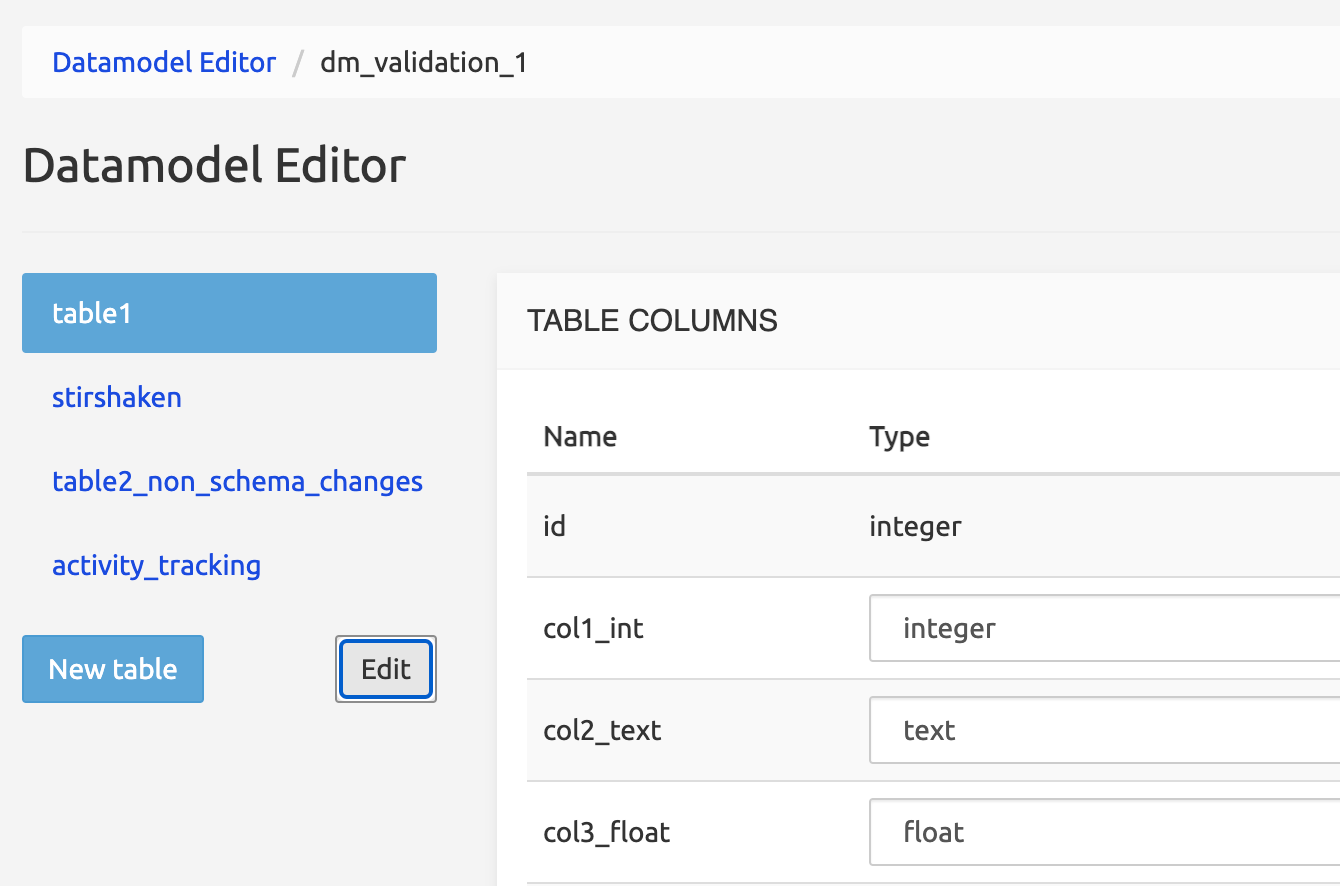
To delete a table, click the Edit button: this shows all tables in the left panel with up and down arrows and a Delete icon. Click the Delete icon of the table to be deleted, confirm the deletion in the modal window that appears, then click Done.
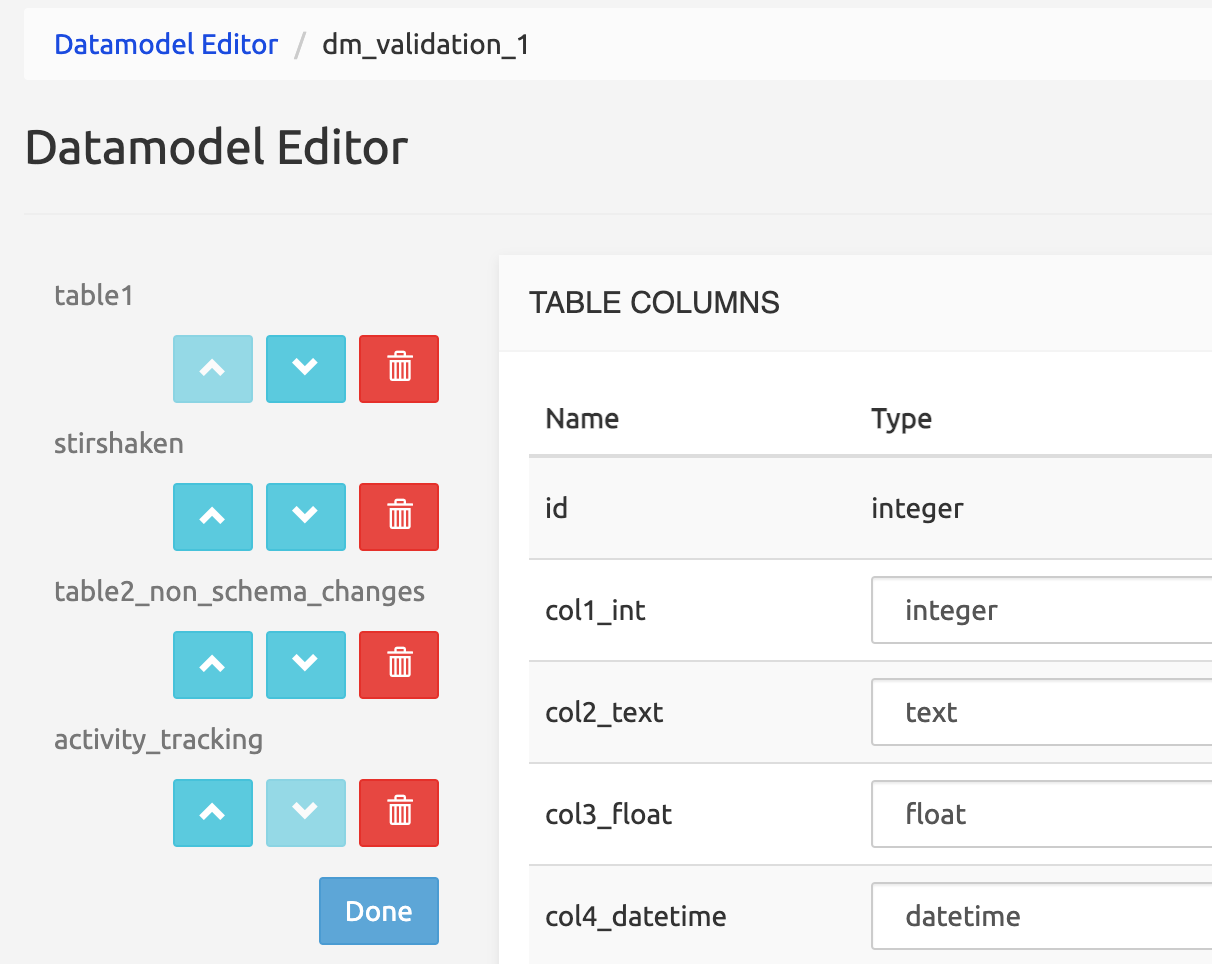
To change the order of the tables, click the Edit button in the left panel then the arrow buttons. This affects the order by which the tables are shown in the Data Administration main tab.
Table Columns
Type a valid name (lowercase, start with a character and can contain characters, digits or _) for a column, then click Add column.
Select a data type: text, integer, float, date time, boolean, or, if other tables are present, foreign key.
WARNING
If a foreign key (a column from another table in the service) is selected, it must be unique, allowing a non-ambiguous 1-to-1 relationship. It is strongly recommended to use the ID column (primary key) in the other table as a foreign key, and to set which columns(s) of the external row will be shown here through the Record Label Format field (see Data Administration Interface below).
Check one or more options:
indexed: the values of the field are indexed, providing faster search results in the Data Administration GUI.
unique: any value for the field must be unique in the whole table.
nullable: if checked, the field left empty takes the NULL value. If not checked, the field is not nullable and cannot be empty. Therefore, when not nullable, a default value must be populated.
default value: if a new non-nullable column is added to a table having already a dataset, this option provides a value to fill in the new column in the records created before the addition of the new column. Changing an existing column from nullable to non-nullable will not modify the records already present in the table.
To change the order of the columns within a table, use the arrow buttons at the right end of each line. This also affects the order by which the columns are shown in the Data Administration Interface section below.
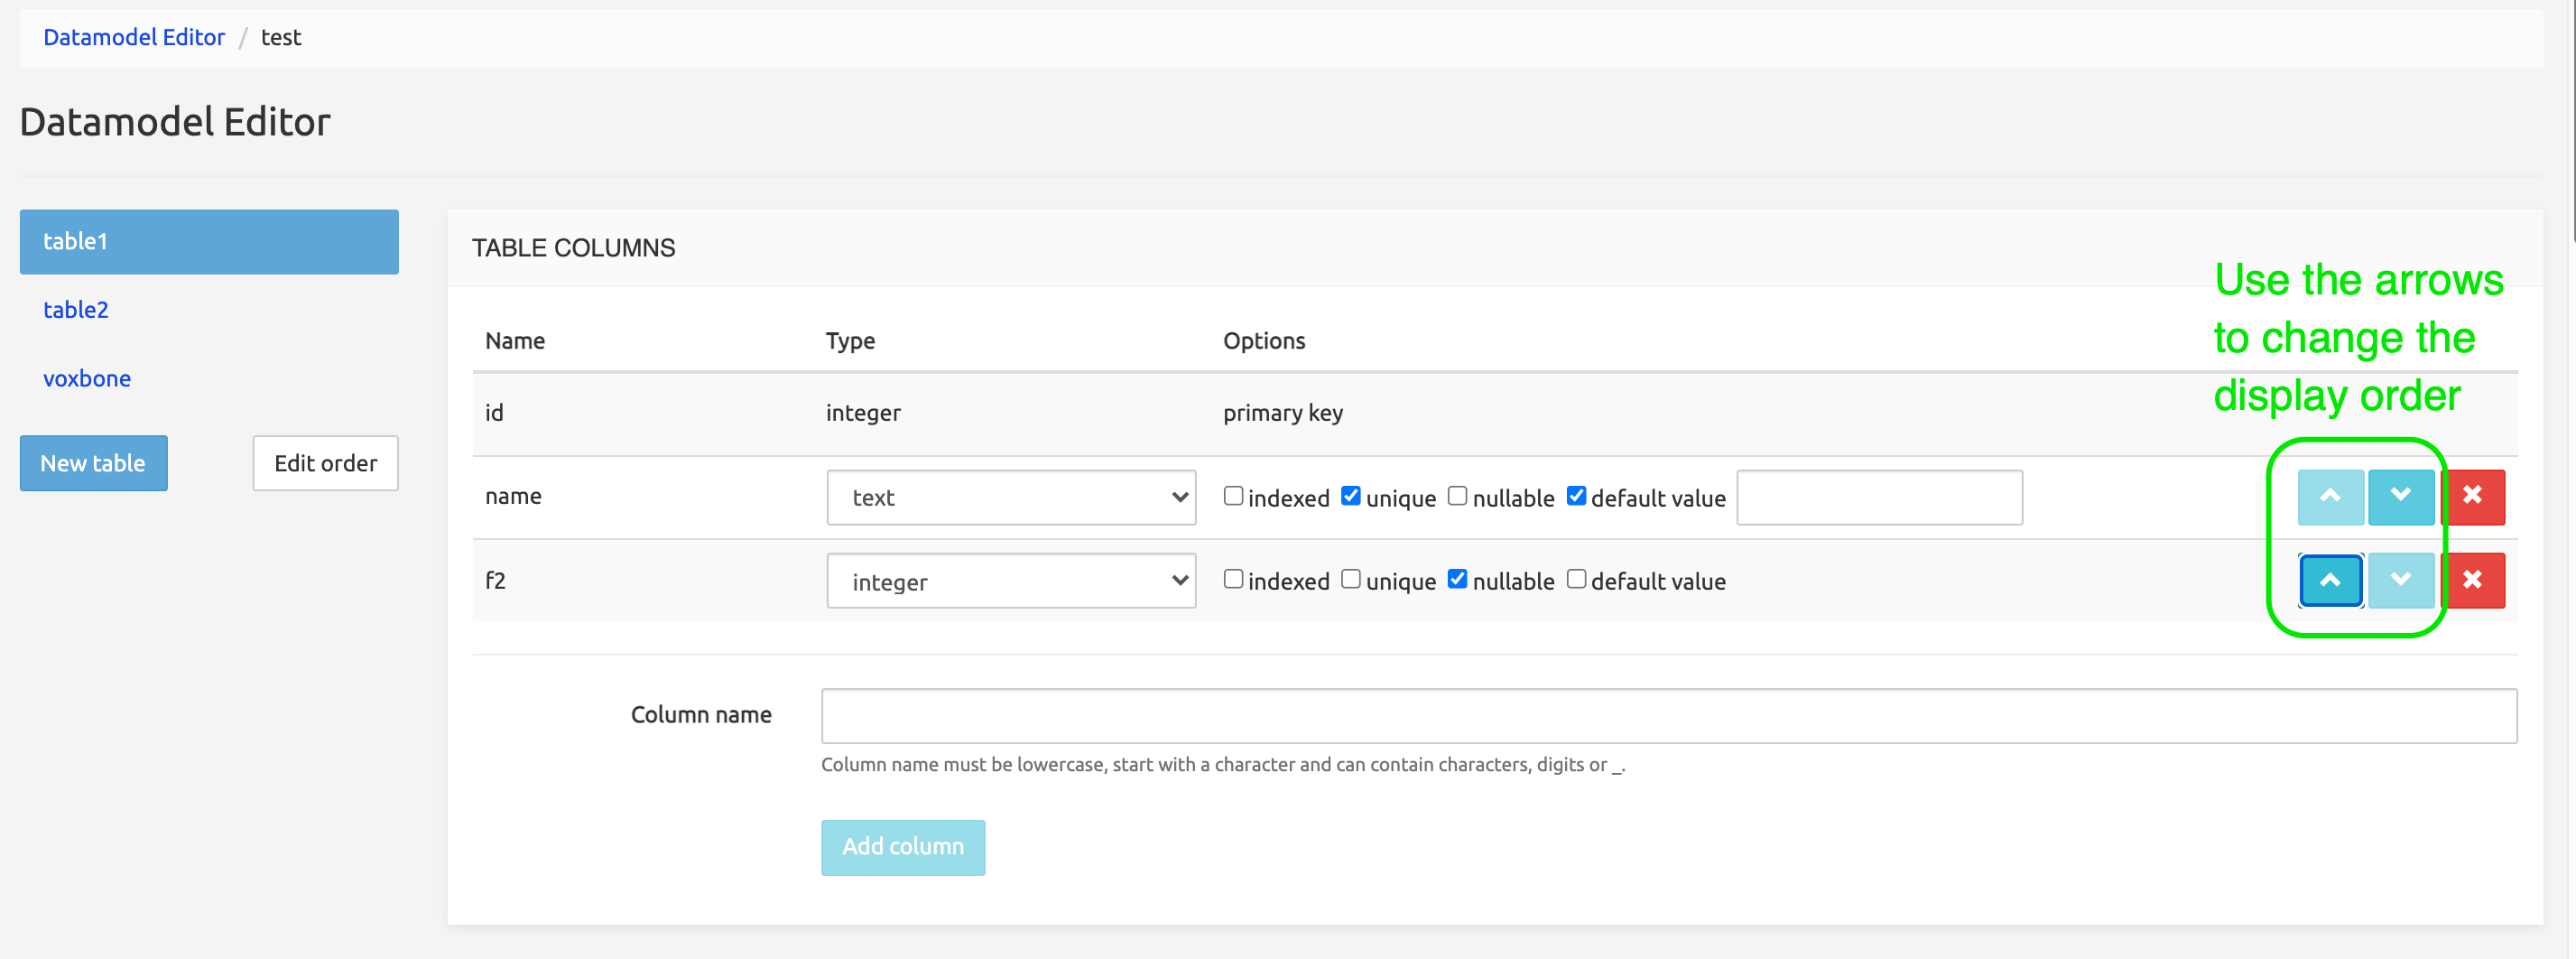
It is possible to rename columns already present in the activated datamodel by clicking the edit icon next to the column name. Press then confirm or cancel icon to confirm the new name or restore the old name.
Multicolumn Indexes
This section allows creating an index over two or more columns, with or without a Unique option. The indexes created are simply listed at the top of the form with the indication of the columns used and can be removed using the Delete button.
Check Constraints
This section allows defining check constraints on a whole table, to prevent values in several columns. Check constraints on a single column are implemented using validators as described in the section Data Administration Interface below.
For example, with this check constraint: age>=18 AND city!='Brussels', no record will be created if age is under 18 and city is 'Brussels', and a message indicating a violation of the constraint will be thrown.
Such constraints are checked at the database level and supersede any validator on a single column.
Data Administration Interface
This section is where you define how the table will show in the Data Administration GUI.
Labels
Table label: defines the label that will be used to show the table name in lists and on the data management page.
Record label format: defines the format for displaying the values of a record if used as a foreign key in another table. Columns of the record can be selected using [placeholder] syntax, like
[id] separator [column02] separator [column01].Note that this label will only appear in other tables using this record as a foreign key, not in the table where you define it.
Track activity: check this box to enable tracking user operations on this table with modification time.
Display
This allows selecting the columns that will appear in the Edit Record / New Record pages in the Data Administration GUI. Note that the ID column is currently not shown (despite being selectable).
The Label column allows defining alternative labels for the columns of the table. These labels are used in lists and data management pages, in a similar way as the Table label above.
The hidden flag allows hiding the content of the column after the first entry. Lists and data management pages will not show the current value of this column.
The textarea flag allows entering a long portion of text preserving newlines. This is useful for example to paste certificates or PEM-encoded keys in this column.

Validators
This allows defining a validator, i.e. a condition or constraint, for each column specifically. The validator is only applied when adding or editing a record through the Data Administration GUI, not through REST API or batch provisioning. It helps the user by enabling a pre-validation for the entry (see Note below). If the value in the column does not match the condition set by the validator, the record is not created and an error message is thrown, allowing for immediate correction.
The drop-down list presents the available validators. Some require extra information, like range values, lists of acceptable values or legitimate addresses like IPv4 / IPv6 ones.
INFO
In any case, the entry validation at GUI level is rechecked at the database level and database check rules always supersede the validator's rules.
CSV Import
When Enable CSV import is checked here, the Import from CSV feature becomes available under the Batch Provisioning button in the Data Administration page of the table, allowing import of a CSV data file (using comma [,] as delimiter).
When CSV header is checked, it tells the Import process that the CSV data file to import has a header as the first line, and this line must not be imported.
Validate CSV header format expects column names spelt exactly (lower/uppercase included and comma separated). Validation is done to ensure that the columns in the header line of the CSV file are identical and in the same order as the column names given here. If left empty, no validation is performed.
Unique set of columns for updates: this allows selecting which columns are checked against a uniqueness conflict, that is, the columns that will be used to verify whether a record is already existing and must be updated rather than created anew.
Example 1
The table has a record BGC,Proximus for columns shortname,fullname. Both columns are unique. The CSV file to import has a record with PXM,Proximus. Since Unique set of columns for updates is set to fullname, then the record BGC,Proximus will be updated as PXM, Proximus. Other columns are unchanged.
Example 2
The table has a record with 12,BGC,Proximus for columns version,shortname,fullname. The CSV file has a record with 12,PXM,Proximus. As the column shortname is not in the list of Unique set of columns for updates (while fullname is), the 12,BGC,Proximus record will match an existing record which will be updated as 12,PXM,Proximus. It will not be created as a new record.
A mapping table must be defined by adding CSV fields defining pairs: position nn (in the CSV file) = target column nn. If this mapping table is left empty, no Import happens.
INFO
Some CSV columns to import may have no significance for the SRE. Such columns can be skipped, by selecting None for the target column(s) to skip in the mapping table.
This table also allows defining preprocessors for the data to import.
None: data are imported as is.
Empty field is NULL: an empty value (a string of length=0) is replaced with the NULL value. Setting this option is recommended for fields that use Null rather than an empty field.
Format datetime: the only valid DB format for a datetime value is
yyyy-mm-dd hh:mm:ss(Python coding:%Y-%m-%d %H:%M:%S). If the imported data do not match that pattern, Python coding is used to tell the Import process the format of the imported data so it can convert it to a valid format.Datetime value to import:
03/02/2020 13:14:01. This is%d/%m/%Y %H:%M:%Sformat. To convert the value to the valid format, specify the current format (%d/%m/%Y %H:%M:%S) in the Format datetime field.Resolve foreign key - Foreign table field: this preprocessor allows resolving a foreign key (a column of another table) by defining a foreign column different from the one specified in the foreign key, for example, because the column used to define the foreign key is not available in the CSV data to import. The format for the
Foreign table fieldinput must be<table-name>.<field-name>.Example:
table01has anidcolumn.table02has a column defined as a foreign key usingtable01.idas a value. Data to import intable02don't have values for theidcolumn oftable01. For the sake of simplicity, another column oftable01can be specified intable02/ Resolve foreign key - Foreign table field as an alternative, so that the foreign key intable02can be resolved usingtable01.<alternativeColumn>. ThealternativeColumnmust be unique withintable01.
Please see Data Administration, Batch provisioning for details on Import from CSV action.
Export to CSV
When Enable CSV export is checked here, the Export to CSV feature becomes available under the Batch Provisioning button in the Data Administration page of the table, allowing export to a CSV data file (using comma [,] as delimitor).
Export CSV header format: if a header is desired in the exported file, specify here the names to use as header labels (comma separated). Example: FULLNAME, SHORTNAME. These names don't have to match existing column names in the table: this is managed by the mapping table just below.
A mapping table must be defined by adding CSV fields defining pairs: position nn (in the CSV file) = source column name. If this mapping table is left empty, no Export happens.
Postprocessors can be specified for the values of each column. They are similar to the preprocessors described in Import from CSV just above, but just work the other way around.
None: data are exported as is.
NULL is Empty: NULL value is replaced by an empty value (a string of length=0).
Format datetime: the DB format for a datetime value is
yyyy-mm-dd hh:mm:ss(Python coding:%Y-%m-%d %H:%M:%S). You can specify here another format using Python coding to convert the datetime values in a standard format to the format desired for export.Datetime value stored in DB table:
2020-02-03 13:14:01. This is%Y-%m-%d %H:%M:%Sformat. The desired exported value is03/02/2020, without time. To convert the value to the desired format, specify%d/%m/%Yin the Format datetime field.Replace foreign key with field: the foreign key column is replaced by the content of the field in the foreign table.
Foreign table fieldinput must specify a valid column name in the referenced foreign table with the format<table-name>.<field-name>.
The exported file is stored on the SRE server and can be downloaded using the link in the System/Jobs list. The Job information line (above the link to the file) opens a Details window which can help understand why the export failed. A usual case is an invalid value present in one or more records.
Please see Data Administration, Batch provisioning for details on Export to CSV action.
Delete Table
Clicking Delete table will drop all records contained within the table and the table itself after the new (saved) version of the datamodel is activated. You can thus roll back the Delete action by not saving the datamodel, selecting Datamodel Editor and reloading the service.
Note that if a column in the table being deleted is used as a foreign key in another table, a warning is displayed asking for a valid type for the column that had the foreign key as type.
Example when deleting table01: A valid column type should be selected for column col2 of table table02, where col2 in table02 is a foreign key from table01.
Save New Datamodel Version
This button saves the current definition of the datamodel, adding one more version in the Datamodel Versioning list, but does not activate this latest version. See below how to activate it.
Datamodel Versioning
The Datamodel Versioning command in the Datamodel menu opens the datamodel development history.
This powerful interface:
- stores the successively saved datamodel versions
- documents changes to the schema (adding or removing columns, indexes etc.)
- allows activating one version, usually the latest saved one
- allows exporting the datamodel (without data)
- allows backing up the active version (with data)
- allows restoring any version, active or not, that has been backed-up.
Versions are listed with the latest version on top of the list and links to show the active version and the first version.
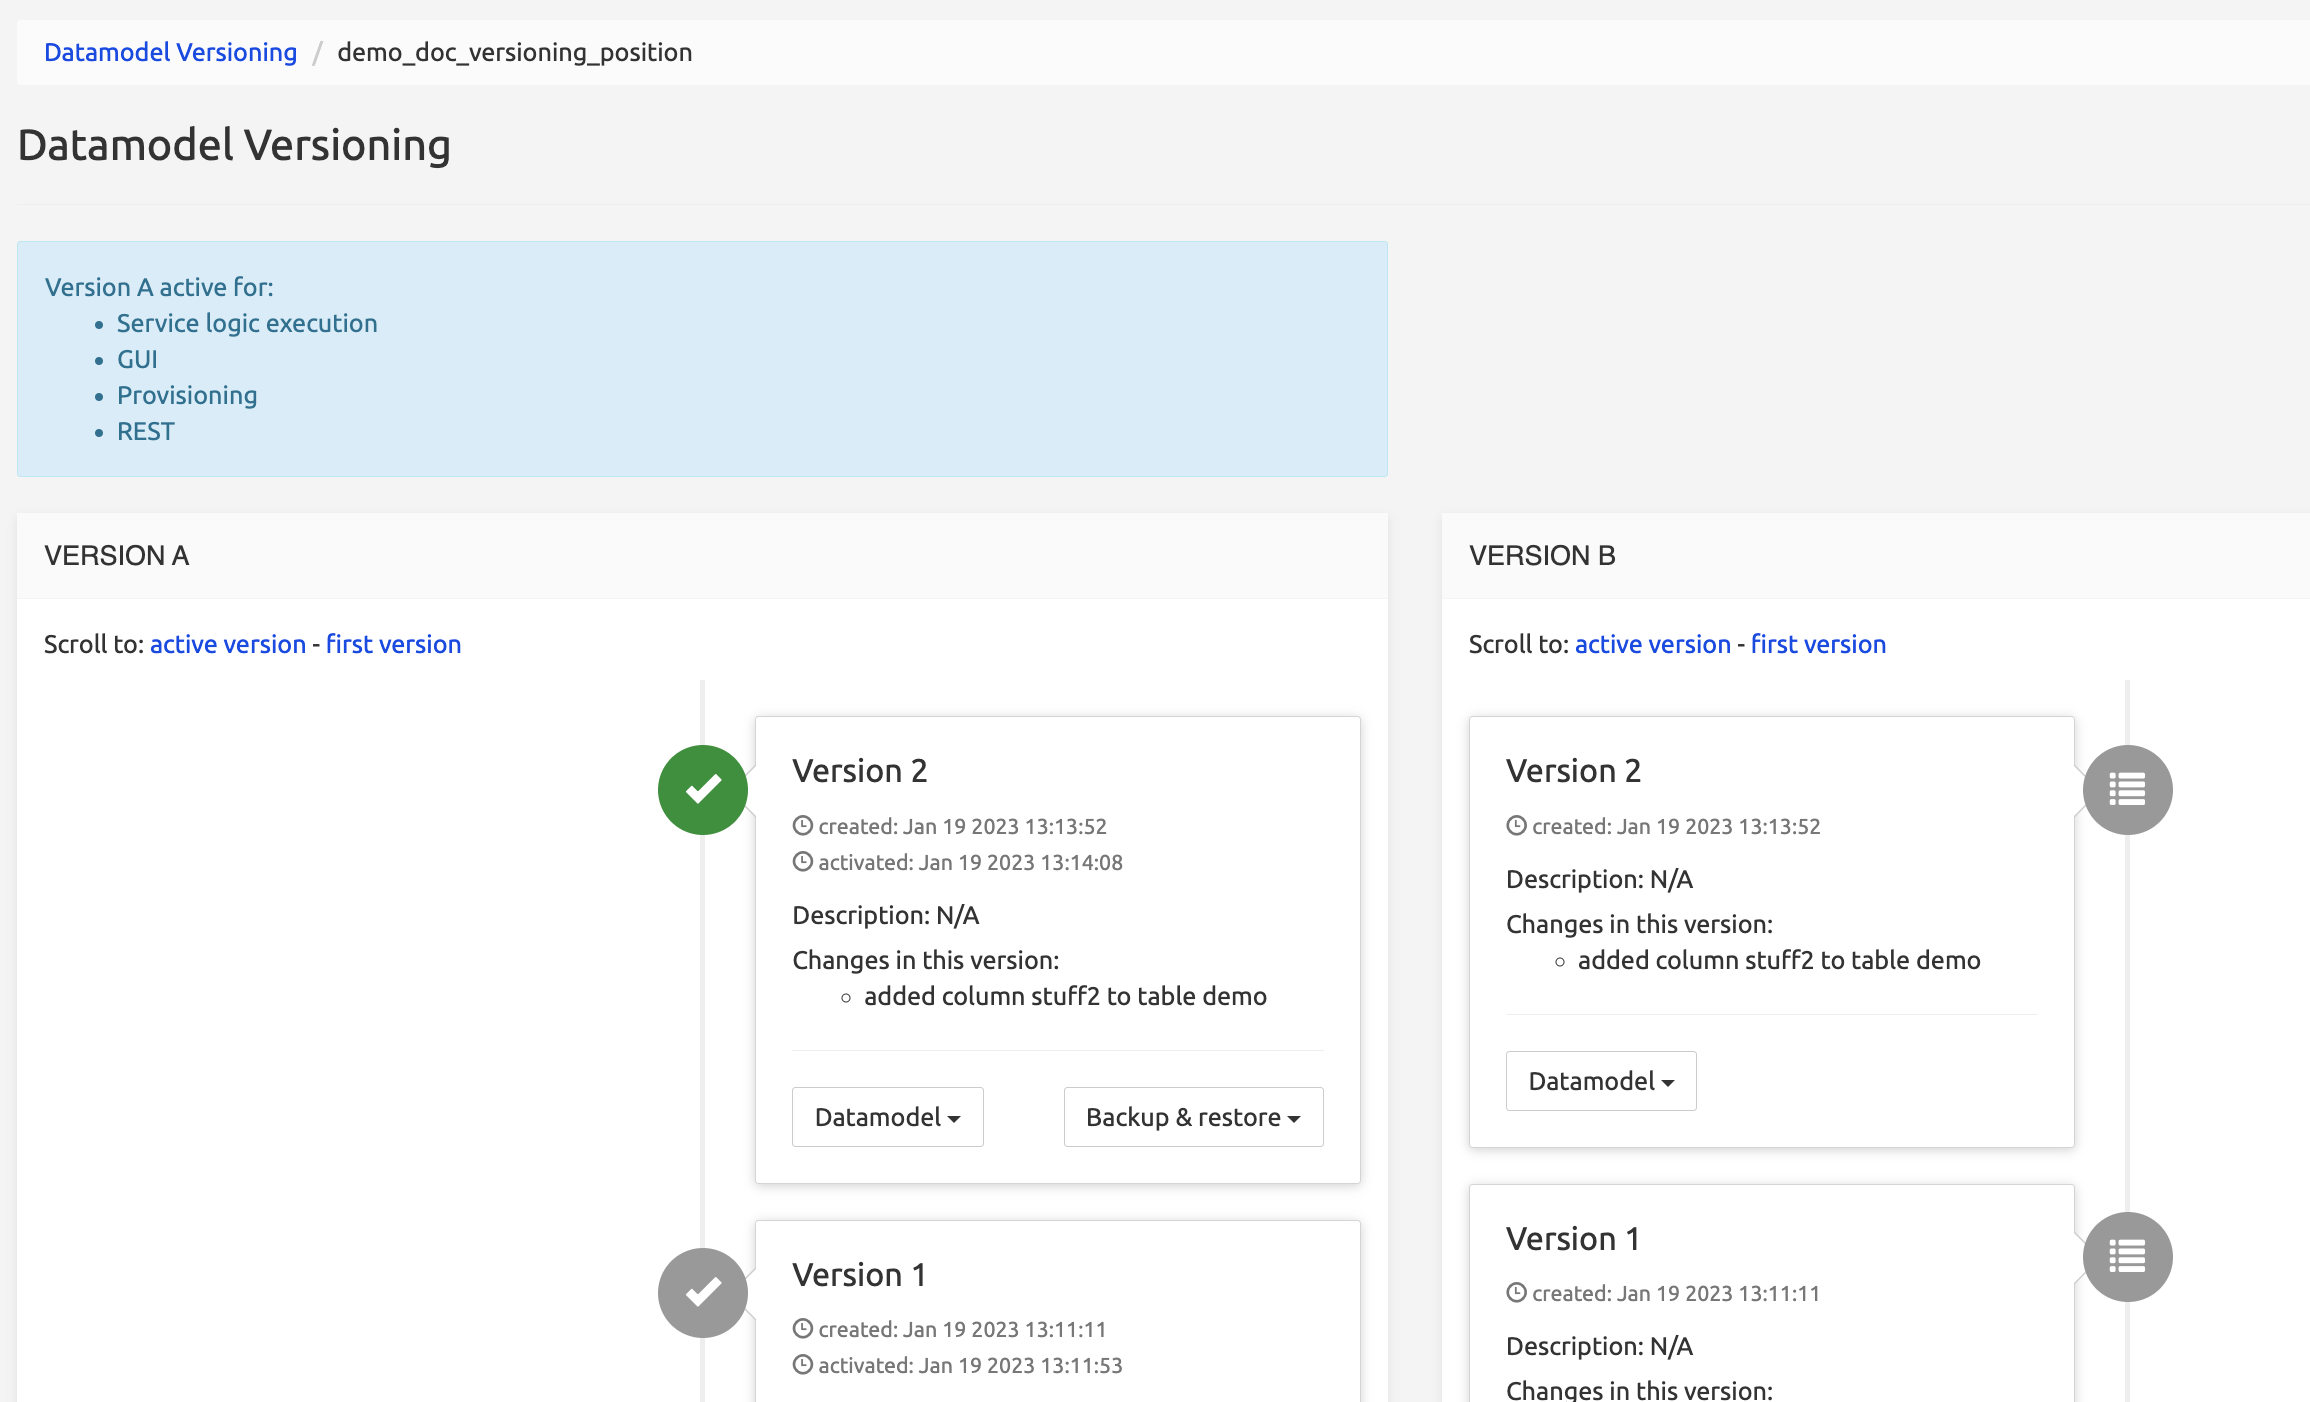
Versions show now all changes (schema and non-schema).
Versions are listed with an icon indicating the status of the version:
+-----------------------------------------------------+-----------------------+-----------------------+ | Icon | Meaning | Comment | +=====================================================+=======================+=======================+ |  | Skipped | Never activated | +-----------------------------------------------------+-----------------------+-----------------------+ |
 | Saved / Activable | Always at the end of | | | | the list. More than | | | | one version can be | | | | saved in sequence, | | | | all can be activated. | +-----------------------------------------------------+-----------------------+-----------------------+ |
| Active | The currently Active | | | | version | | | | | | | | (only one version can | | | | be active at a time) | +-----------------------------------------------------+-----------------------+-----------------------+ |
| Was active | Has been activated, | | | | then a newer version | | | | has been activated, | | | | switching this to Was | | | | active. | +-----------------------------------------------------+-----------------------+-----------------------+
The list shows a Version A column and a Version B column. This relates to the Data Versioning mechanism explained in Data Versioning. Please refer to that section for more information.
Activating a new version of the datamodel
Once saved with Save new Datamodel Version in the Datamodel Editor, switch to the list of versions by selecting Datamodel/Datamodel Versioning. The page shows all the services present on the system. Click the Manage button for the desired service: this opens the Datamodel Versioning page for this service.
Scroll down to the bottom of the list. You can see there the active version, marked with a green checkmark, and below, as the last entries of the list, and the latest saved versions (one or more are possible). Select Datamodel / Activate on one version to make this version the active one, i.e. the one that will load when selecting a table from the service in the Data Administration menu.
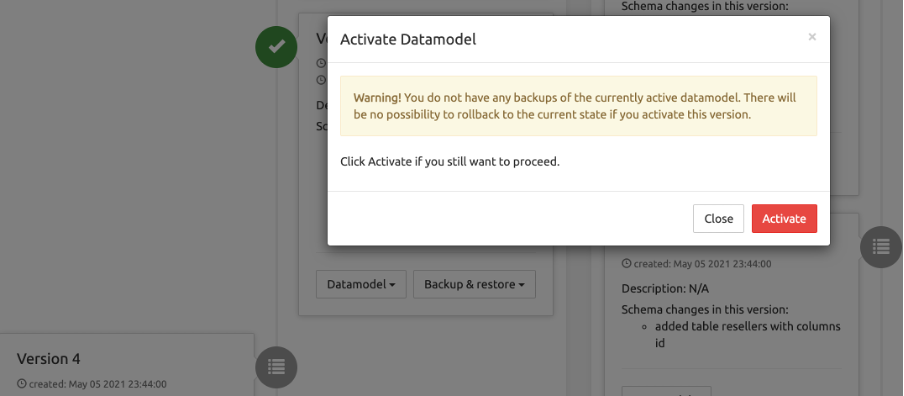
Activating a new version of the datamodel will show a warning if the user has not yet made a backup of the current datamodel version.
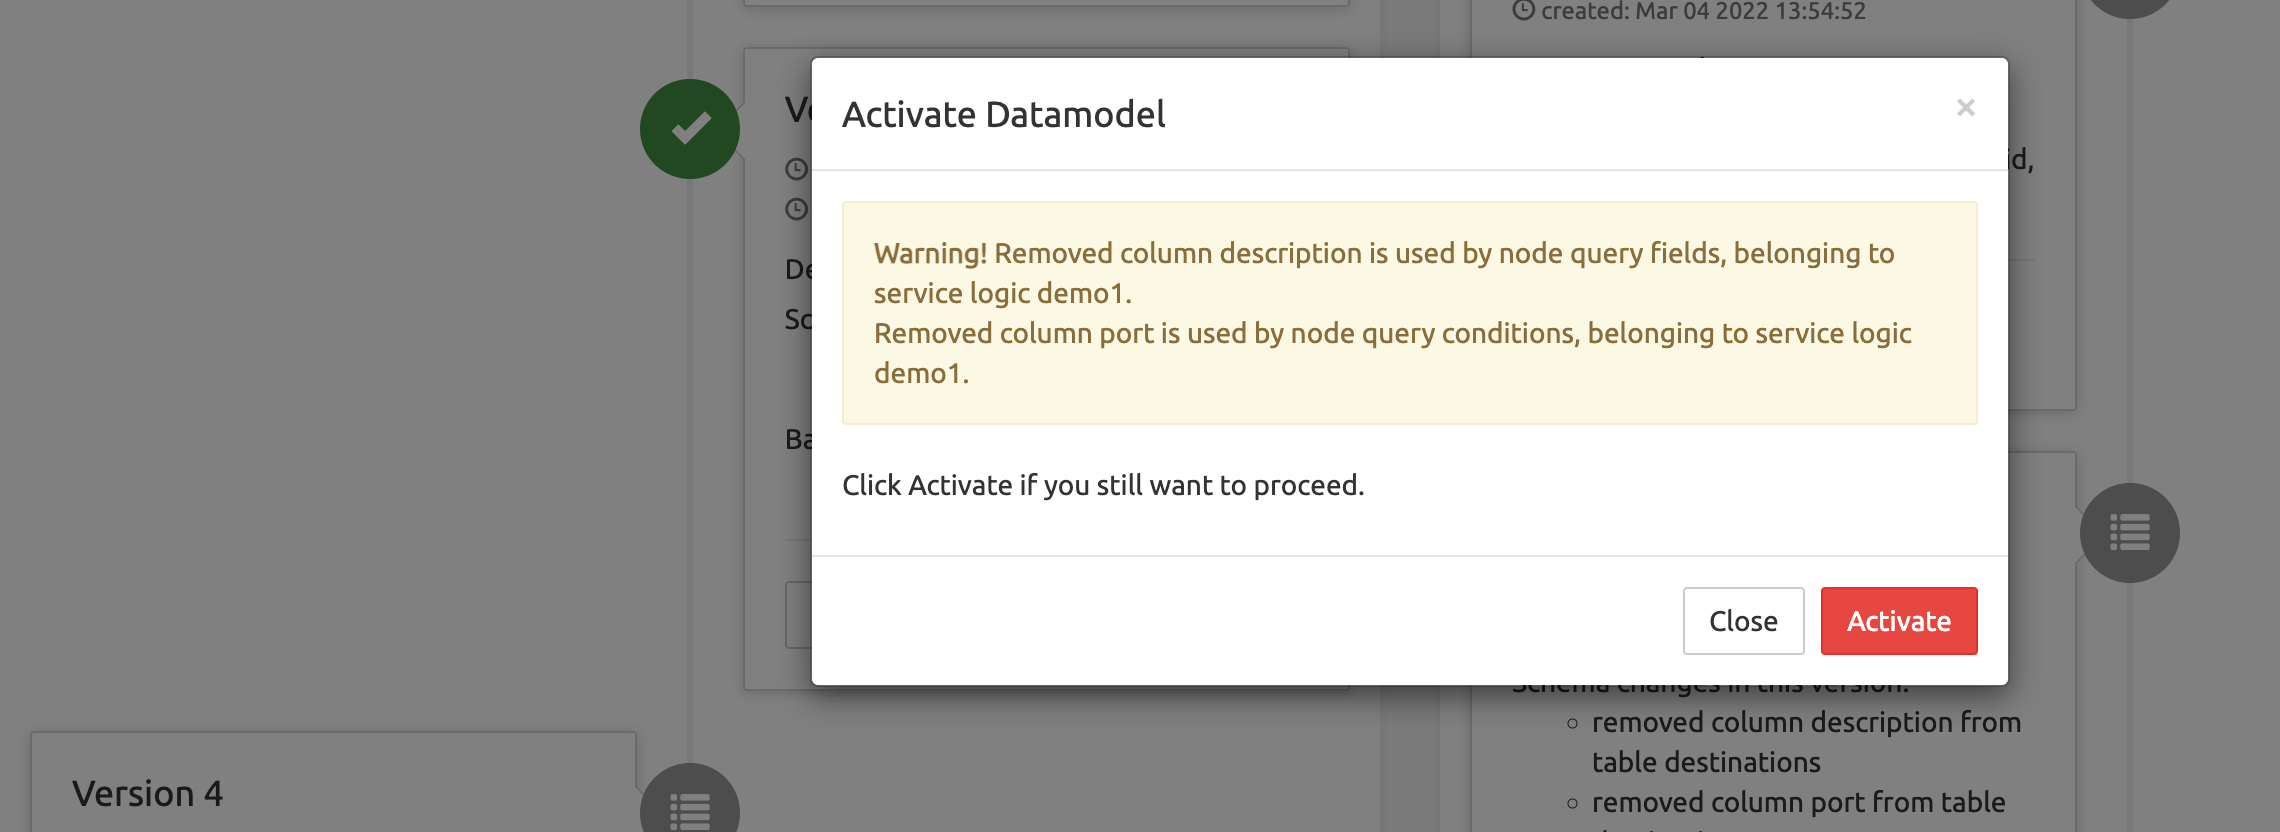
In addition, it will show a warning if the modification potentially affects the active Service Logic.
Re-activating a previous version of the datamodel (rollback)
You can re-activate a previous version at any moment. For example, you have saved version 13, but the changes you've made to the datamodel are not satisfactory and you want to restart from version 10: simply scroll to version 10 and select Edit this version. In the Datamodel Editor page that opens, make the needed changes, then save them as a new version, go back to Datamodel Versioning and activate this last version (14). All previous versions (11, 12, 13) remain available and editable, but cannot be activated without being first edited and saved: only the latest saved version can be activated.
In the case an inactive version has been backup-ed, it is possible to restore it: this will make this version the active one, in a one-step rollback: see Restoring a backup-ed version below.
Other operations on versions
All versions can be edited, as explained above, exported and, if backup-ed at least once, restored.
Only the Active version can be backup-ed.
Exporting a datamodel definition
This operation is possible on all versions, inactive or not. It prepares a file to be imported into a target service, typically to move a datamodel from a development environment to a production environment.
WARNING
Exporting a definition of a service DOES NOT EXPORT its data. After importation into a target service, the tables are empty. Existing records in the target service tables are kept provided the imported datamodel has columns by the same name as the target columns.
For a given version in the Datamodel Versioning list, select Datamodel / Export definition. This allows saving locally a .datamodel file that will be used in Datamodel Editor LIST page to be imported into another service (see Importing a datamodel above).
WARNING
The Import operation replaces the existing datamodel of the target service, and will automatically save and activate a new version for this service.
Exporting a datamodel diagram
This operation is possible on all versions, inactive or not.
For a given version in the Datamodel Versioning list, select Datamodel / Export diagram.
This generates a table presenting in PDF format the list of the fields in the datamodel with their type, with full information in the name (for example, datamodel-service_demo_doc_export_dm_diagram-version_1.diagram.pdf). This file can be saved locally or opened in a new browser tab, then used for information or datamodel edition purposes.
Backup of the active version
INFO
The Backup operation is only possible on the Active version. It is important to note that the operation affects the recorded data. If you backup the version at 08:00, then delete 10 records out of 20 and create a second backup at 08:15, then add 5 more records, restoring backup 01 will give you back the 20 original records, while restoring backup 02 will give you back the 10 records, in both cases ignoring the 5 records added after backup 02.
The backup-restore sequence is thus especially useful to «freeze» the database in its state before batch provisioning.
To backup the active version in the Datamodel Versioning list, select Datamodel / Backup & Restore. If no previous backup has been made, the Restore operation is not available. Select Backup this state to create a .dump file. When created, the file appears in the System / Jobs list.
Restoring a backup-ed version
The Restore operation is only possible with a version that has been backup-ed, but it does not matter if the version is active or not: restore is also possible on inactive versions for which a backup exists.
To restore a version in the Datamodel Versioning list, scroll to it then select Datamodel / Backup & Restore. From the list of backups, select the backup file you want to restore. When done, a Job information line appears in the System/Jobs list. Click this line to open a Details window showing the restore operations.
If the restore operation is made on an inactive (previous) version, it makes this version the active one (because the backup is of an active version), and switches the later version(s) to activable.
System
The System section of the GUI presents a menu allowing to manage configurable items, settings and parameters of the SRE.
Permissions
The Permissions command displays a simple paginated list of the users and roles registered in the system.
Each user is associated with a role. The roles define which modules and services are accessible to the users.
Users tab
The Search field on the top right allows filtering the list with any string (digits or characters or both).
On each row, Edit and Delete buttons allow managing the entry.
- Edit opens an Edit User form where the username, description, password and role may be changed.
- Clicking Delete immediately deletes the user record (without Undo and confirmation). The admin user is protected from deletion.
The New User button below opens a New record form with a username, description, password and role fields, allowing to add a user.
When creating a new user, a checkbox " Change password on next login" is added to the New record screen. Selecting the checkbox prompts the user to change the password on the first login.
Normal operations do use user authentication. It can be disabled by setting System / Settings / GUI / Enable Authentication to No (essentially designed for some maintenance operations to be performed by I&S personnel).
Roles tab
The Search field on top right allows filtering the list with any string (digits or characters or both).
On each row, Edit and Delete buttons allow managing the entry.
- Edit opens an Edit role form (see Create Role / Edit Role below).
- Clicking Delete immediately deletes the role record (without Undo and confirmation). The admin role is protected from edition and deletion.
The New Role button below opens a Create Role form.
Create Role / Edit Role
The Create or Edit Role forms, very similar, display the list of the SRE modules and their menu commands, allowing to grant/deny access to each using the Read / Edit / None buttons. Changes must be saved and the user must log out then log in for the changes to their rights to be applied.
Available options are the following.
Dashboard
Tabs:
- Service overview
- System details
- SIP agents status
- Stats
Permissions:
- Read: role can access page in view-only mode.
- None: page is not accessible and hidden.
Data
This section allows to set permissions on data access per table.
Permissions:
- Read: role can read records of table.
- Edit: role can modify or remove records from table.
- None: role cannot access records of table.
Data model editor
In this section you can allow or deny access to datamodel editor.
Permissions:
- Edit: role can access datamodel editor
- None: no access to datamodel editor
Data model access
In this section you can allow or deny access to datamodel editor on datamodel basis.
Permissions:
- Open: role can access datamodel editor
- Edit: role can access datamodel editor
- None: no access to datamodel editor
Service Logic
In this section you can allow or deny access to service logic editor and selection pages.
Permissions:
- Read: role can access page in read-only mode.
- Edit: role has full access.
- None: role cannot access the page.
Service Logic access
In this section you can allow or deny access to service logics based on tags.
Permissions:
- Read: role can access service logic in read-only mode.
- Edit: role has full access.
- None: role cannot access service logics with this tag.
These settings can only restrict global permission of service logic.
The table below illustrates the interaction between both sets of permission settings.
| SLE editor permission | Tag permission | Outcome |
|---|---|---|
| Read | Read | Read |
| Read | Edit | Read |
| Read | None | None |
| Edit | Read | Read |
| Edit | Edit | Edit |
| Edit | None | None |
| None | Read | None |
| None | Edit | None |
| None | None | None |
Service Logic simulation
In this section you can set permissions for service logic simulation.
Permissions:
- Run only: role can only run simulations.
- Edit: role has full access.
- None: role cannot access simulation tabs.
System section
In this section you can set permissions for access to the following pages:
- Users
- Access Tokens
- Access Tokens Manager
- Settings
- Licenses
- Node operational status
- Data versioning
- SIP monitoring
- Tracing
- Alarms
- Jobs
- Calls
Permissions:
- Read: access page in view-only mode.
- Edit: page is accesible and new entry can be added or previous entries can be modified.
- None: page is not accessible and hidden.
Access Tokens
SRE admins can generate API tokens that are then mapped in an IT system interacting with SRE on the REST API (Provisioning) interface. In this way, it becomes possible to use it alternatively to username and password (Basic Auth).
Nevertheless, it's still possible to opt for Basic Authentication. Both modes can even coexist.
Creating or deleting API keys is done through System > Access Tokens
The Access Tokens command displays a paginated list of the Access Tokens defined in the system.
Once a new token is created, it is listed on the screen.
For security reasons, it is not possible to retrieve API tokens once this screen is closed. If the token is forgotten, another token must be created.
Settings
WARNING
The Settings command gives access to all SRE configurable settings. Day-to-day operations do not require any change to the settings configured at deployment time. Modifying these settings can severely impact operations and is therefore strongly NOT recommended. For that reason, only some settings that have a limited impact are documented below. SRE Administrators looking for more information about undocumented settings are invited to request it from Support Team and/or to follow dedicated training.
Advanced settings are shown by selecting them in the top right corner.
DANGER
Changing advanced-settings is extremely not recommended.
GUI
The first parameter Platform name allows providing a specific GUI name for the current platform. This helps avoid confusion when more than one platform is operated (for example one for testing and one for production).
The name of the platform is visible as the title of the browser tab displaying the platform, and also on the SRE top bar, together with the EM name and the SRE version.

Max failed login attempts parameter blocks the login page when the number of (failed) login attempts is reached within 1 minute. This helps prevent brute-force login and throttling.
Alarms
The Alarms tab allows adding SNMP trap receivers and setting the thresholds for various types of events.
SNMPv3 trap receivers can be specified on top of standard SNMP ones.

Check interval for cdrs (secs): the time window after which an alarm is produced in case no CDR has been produced by the system.
INFO
It is recommended NOT to activate this feature in Lab / Testing environments where it is normal not to have calls consistently running on the platform.
Batch Provisioning
The Replace all checkbox can be disabled by default, preventing the replacement of all CDRs in the DB during an Import from CSV operation. When disabled here, the Replace All checkbox is not displayed in the Import from CSV modal window on the table page accessed via Data Administration (see Batch provisioning).
Accounting
The Accounting tab allows setting the following values for CDRs:
CDR timestamps : can be set to Local time (i.e. the one configured in the EM at the OS level during setup) or to UTC.
Enable start CDR: for every call received, a start CDR is produced upon receiving the request. This CDR will contain the set of information available from the request, while it will not contain the information added during the service logic execution or the call outcome.
Enable end CDR: if set to Yes, for every call rejected before the answer, an end cdr is produced, corresponding to the rejection event.
Enable recurse CDR: if set to Yes, for every call where SRE has triggered an internal recursion, an end cdr is produced, corresponding to the recursion event.
Enable stop CDR: If set to Yes, for every call torn down after the answer, a stop cdr is produced, corresponding to the entire call event.
Enable redirect CDR: If set to Yes, for every call redirected by SRE (e.g. SIP 302) a redirect cdr is produced, corresponding to the redirection event.
Interim CDR interval (secs): NOTE: only available with Kamailio 5.x (do not set it with Kamailio 4.x). If set to a value different than 0, for every call that got connected and whose duration exceeds this Interim CDR interval, the SRE will produce an interim cdr, containing the information available up to that time.
Enable HTTP CDR: If set to Yes, a CDR is produced for every HTTP request to SRE. This applies to the HTTP interface linked to a Service Logic, not to be mixed with the native REST API provisioning interface.
Enable ENUM CDR: If set to Yes, a CDR is produced for every ENUM request to SRE.
SIP accounting post-processing output directory: Directory to store post-processed CDRs.
SIP accounting events directory: Directory to store the event files.
Accounting events file rotation interval (mins): Event files are produced by default every 5 minutes.
Operation log items per file: default value is 100000. Increasing this value increases the file size of each operation log and reduces the checkpoint frequency. A single item is 1 KB on average.
Timeout for unrefreshed calls (secs): If the call status is refreshed with OPTIONS messages, this parameter defines the timeout after which the call must be considered closed and a stop CDR must be generated. Set this parameter to 0 to disable the feature.
REST API Provisioning
This tab allows modifying --- only if needed --- the port on which the EMs are listening for REST API calls (provisioning), whether SSL is used or not, and whether the APIs are protected by username/password.
For authentication, the user or API token must be provisioned with the relevant permissions respectively in the System > Permissions or the System > Access Tokens menu.
GUI: access using https with own certificate
To use the https protocol to access the SRE GUI with its own certificate:
The certificate must be stored as
cert.pemin/opt/sre/etc/sslThe private key must be stored as
privkey.pemin/opt/sre/etc/sslThe SSL connection is activated through Settings>GUI>Enable SSL (given the certificate and private key have been stored as indicated above).
SMTP
With SRE alarms are sent not only to one or more SNMP receivers: SMTP notifications to predefined email receivers are also available.
General SMTP settings are configured in this System > Settings > SMTP tab.
Each email target is defined in System > Settings > Alarms along with the minimum criticality (INFO, MINOR, MAJOR, CRITICAL) that an an alarm must have to trigger the sending of the email.
Licenses
Some SRE modules are available through a licensing system only. When the license is activated, the corresponding nodes of the module are made available in the Service Logic Editor. If the license is not activated or has expired, the existing service logics using the nodes under licensing will work, but no new service logic using them can be created.
- Call Admission Control: the license activates in the Service Logic Editor the processing nodes related to Call Admission Control (see SRE Nodes Description Manual / Processing Nodes Call Admission Control for more details).
- Accounting: the license activates in the Service Logic Editor the processing nodes allowing to customize the CSV CDRs stored in the accounting DB and the CDR Post-Processing output nodes (see SRE Nodes Description Manual / Processing Nodes / Accounting for more details).
- Registrar: when the SRE is used as Registrar, the license activates in the Service Logic Editor the processing nodes allow IP Phones to connect to the SRE (SIP command LOOKUP, REGISTER etc.) (see SRE Nodes Description Manual / Processing Nodes / Registrar for more details ).
- LDAP Query: the license activates in the Service Logic Editor the processing nodes related to the LDAP query node (SRE as an LDAP client; see SRE Nodes Description Manual / Processing Nodes Call Admission Control for more details)
- ENUM/DNS Query: the license activates in the Service Logic Editor the processing nodes related to the ENUM query node and the DNS query node (SRE as an ENUM/DNS client; see SRE Nodes Description Manual / Processing Nodes / Call Admission Control for more details)
- SIP-relay-call-processor: this license is enforced over burstable 10 seconds windows rather than every second. Therefore, it is possible to exceed the CAPS limit over a second, as long as the limit over a 10 seconds window is not exceeded. For instance, a license for 100 CAPS (burstable over 10 seconds window) will allow for 1000 executions over a 10 seconds window, regardless of which time portion they are consumed. When the limit of 1000 executions are reached within a window, it will result in new calls being rejected (« 503 Service not available ») until the next window starts. This is used also for Call Crankback (re-routing). The service logic sends a received call to a destination, but the destination replies «Destination not available» (first relay) ; the service logic computes another route and sends the call to the new destination (second relay). One call has been managed, using two executions. The SIP-relay license sets the limit for such cases to 1000 executions over 10 seconds, with the label «100.00 calls/sec (burstable 10 secs)». If this license is deleted, a default license with a limit of 1 call relay over 10 seconds replaces it automatically, allowing the SRE to work without a full license, for proofs of concept, before actual order, for testing alarms, etc.
- SIP-redirect-call-processor: this license is enforced over burstable 10 seconds windows rather than every second. Therefore, it is possible to exceed the redirects limit over a second, as long as the limit over a 10 seconds window is not exceeded. For instance, a license for 100 redirects (burstable over 10 seconds window) will allow for 1000 executions over a 10 seconds window, regardless of which time portion they are consumed. When the limit of 1000 executions are reached within a window, it will result in new redirects being rejected (« 503 Service not available ») until the next window starts. If this license is deleted, a default license with a limit of 1 call redirect over 10 seconds replaces it automatically, allowing the SRE to work without a full license, for proofs of concept, before actual order, for testing alarms, etc.
- SIP-relay-platform: a network-wide license (that is: extended to a whole SRE system, not more than one SRE although this is typically not the case in customer networks). It expresses the number of CAPS the Customer can commercially reach in the overall system for relays. It is a soft limit so exceeding this value will result in an alarm being generated, but the request execution will not be stopped.
- SIP-redirect-platform: a network-wide license (that is: extended to a whole SRE system, not more than one SRE although this is typically not the case in customer networks). It expresses the number of redirects the Customer can commercially reach in the overall system for relays. It is a soft limit so exceeding this value will result in an alarm being generated, but the request execution will not be stopped.
- SIP-session-execution-platform: a network-wide license (that is: extended to a whole SRE system). It expresses the number of concurrent sessions that the Customer can commercially reach in the overall system. It is a soft limit so exceeding this value will result in an alarm being generated, but the calls exceeding the limit will not be dropped.
- ENUM-execution-processor: this license is enforced over burstable 10 seconds windows rather than every second. Therefore the same burstable window mechanism as in SIP-execution-call-processor above will apply.
- HTTP-execution-processor: this license is enforced over burstable 10 seconds windows rather than every second. The same burstable window mechanism as in SIP-execution-call-processor above will apply.
The Licenses command opens the form below.
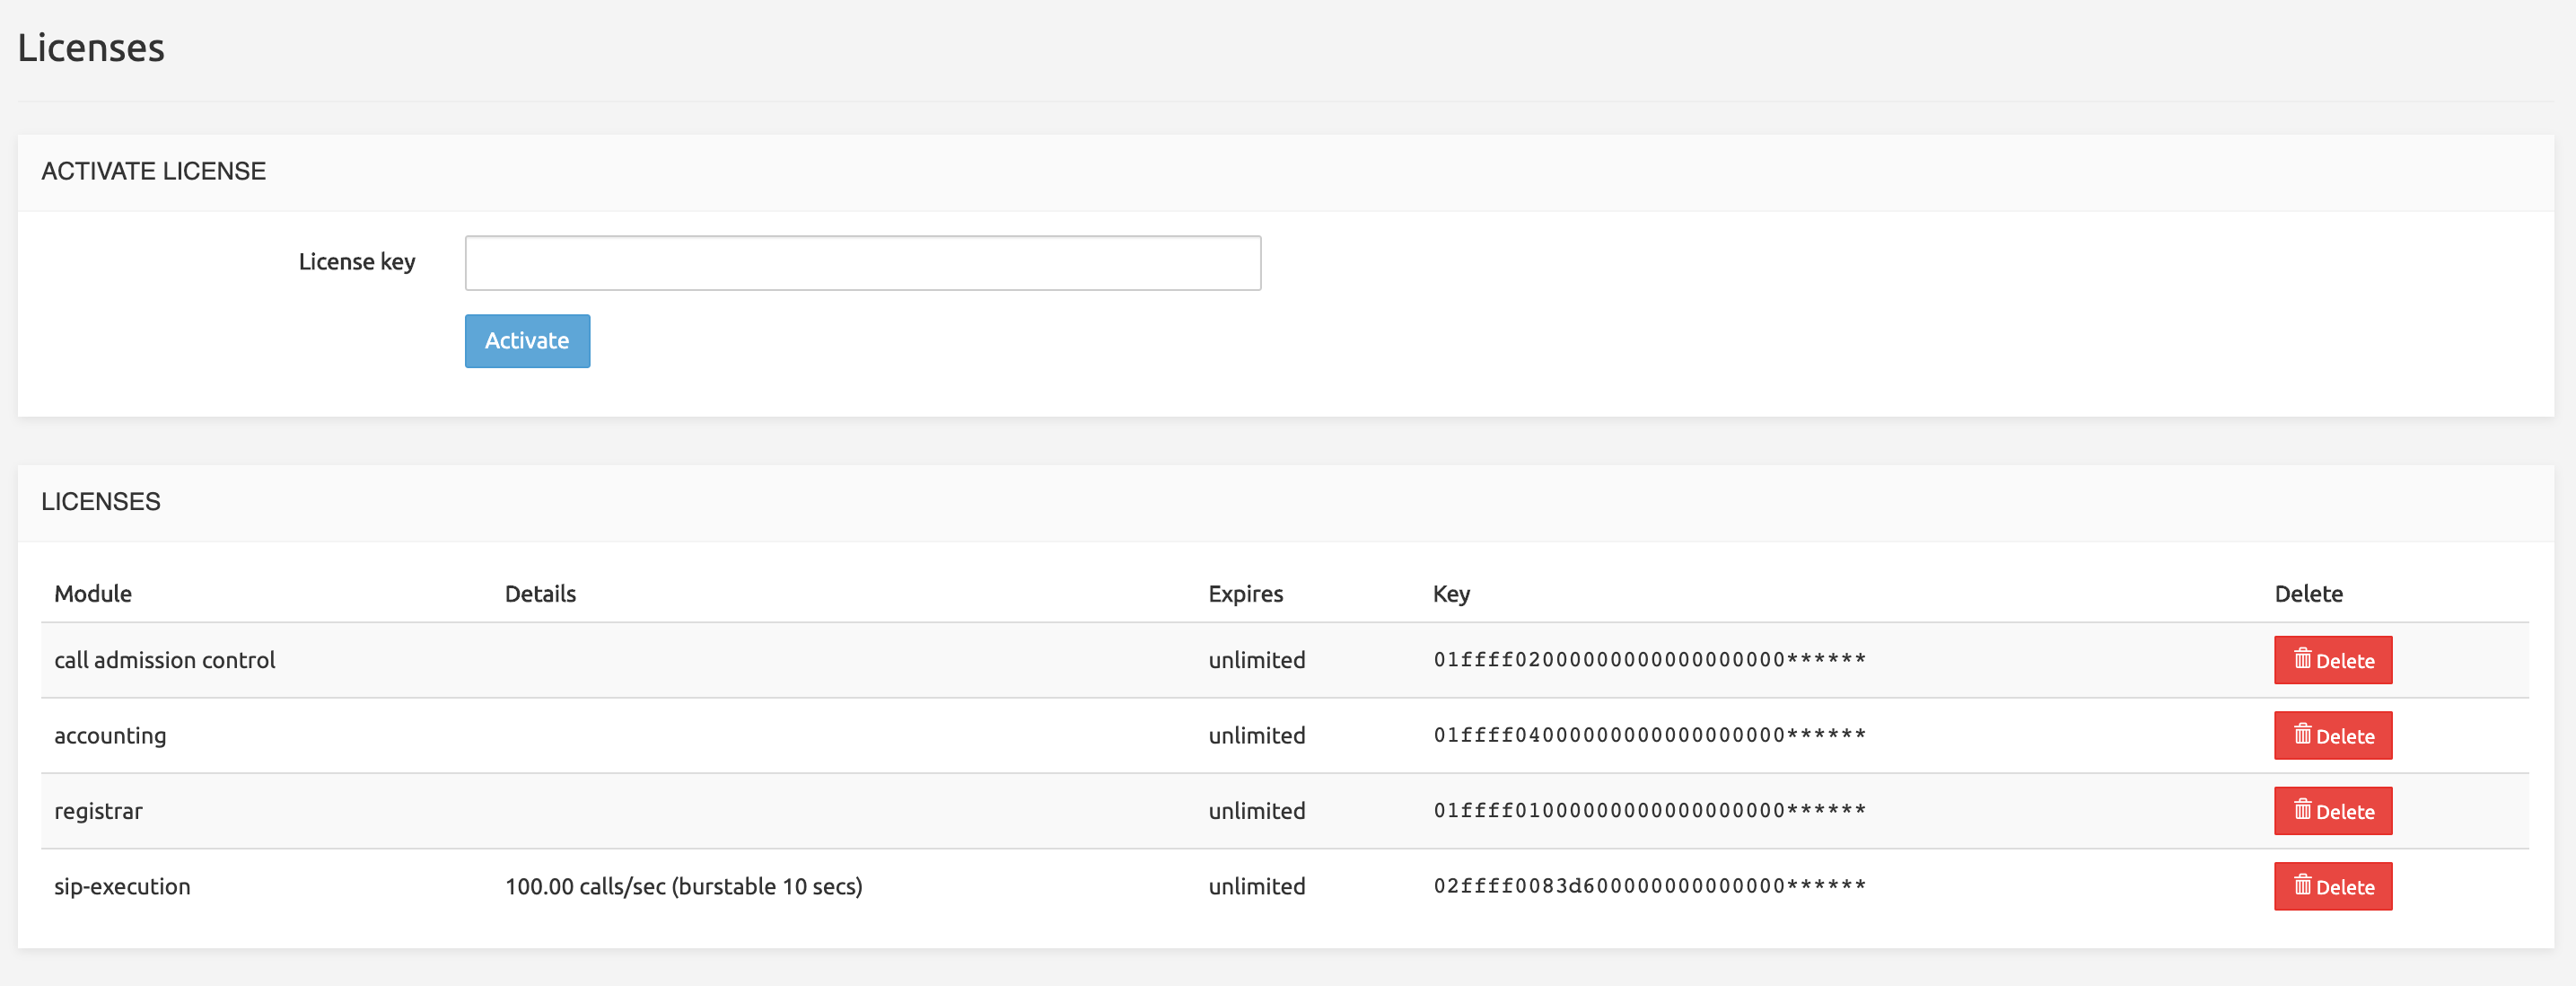
The top part allows activating a license, simply by providing its key.
The bottom part is the list of Active Licenses, with expiration dates if any (licenses may never expire). The Delete button allows removing a license (with a confirmation).
INFO
Only the license that is the most valuable for the customer is listed. If a license has an expiration date in two months and another has an expiration date in one year, only the one expiring one year from now will be listed. The same applies to unlimited versus time-limited licenses.
Nodes Operational Status
The Node Operational Status command displays the list of installed Call Processing nodes and allows putting them in or out of service.
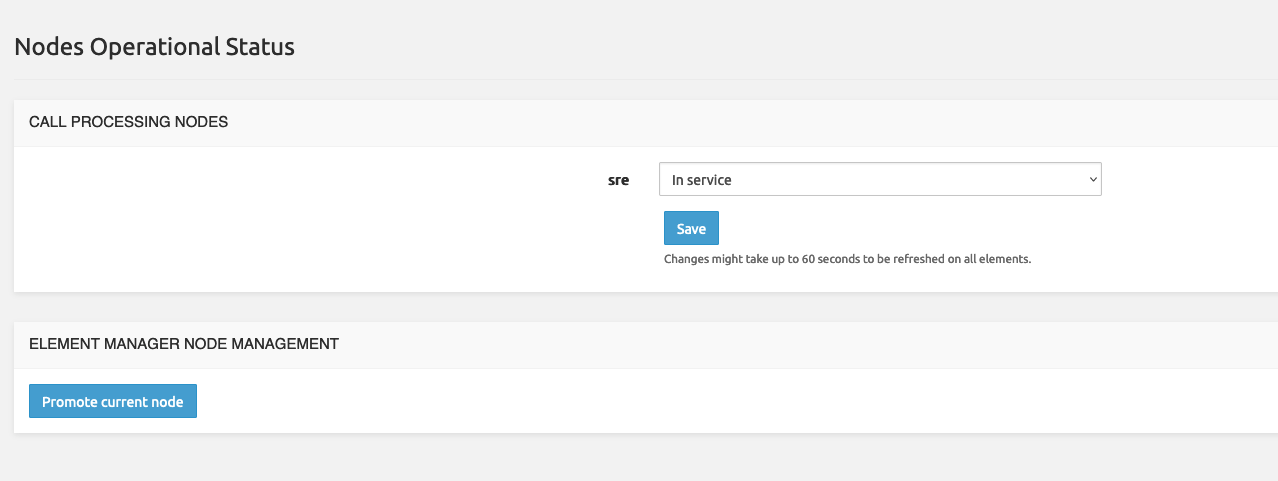
When Out of service, the node will reply with « 503 Service Unavailable » both to internal requests from Element Managers via the sre-broker process and to external systems probing the node to check its status.
Note that the change of status can take up to 60 seconds to be refreshed on all elements.
When you are connected to the standby EM, it is possible to promote the node to master by clicking the Promote current node button. After clicking you will be redirected to the main page.
Backups
The Backups page display a list of database backup entries.

Here's a breakdown of the elements:
Table Header: The table has columns for:
- Service: Identifying the database associated with the backup.
- Side: indicating a specific side of the database backup.
- Version: The version of the backup.
- Created: Timestamp for when the backup was created.
- Download: A "Download" button for retrieving the backup file.
- Delete: A "Delete" button to remove the backup.
Search Bar: There is a search bar to filter backup entries and a dropdown to control the number of entries displayed per page.
Data Versioning
It may be desirable to have two different sets of data for the same service logic, for example, a small one for testing service logic changes and a full one for normal operations. Data Versioning is the SRE feature that allows this. It is based on the following architecture.
Each service database has two versions, labelled _a and _b (see Databases). For example, the service database called lnp will be listed in Dashboard / Databases as lnp_a and lnp_b.
Only databases are listed showing the two version names: database tables (shown in System / Data Versioning / Data Version Selection or Versions Comparison) are listed only once, the display shows A version and B version.
INFO
More databases are shown in Dashboard / Databases than the actual number of service databases: system databases like template<n>, postgres, sre, repmgr do show but are NOT service DBs.
Only one of the two versions of the database and tables can be active at a given point in time. However, SRE offers several ways to perform writes on the databases, the Data Version selection mechanism (see below) allows setting different active versions for each write type: for example, version A will be active for call processing and provisioning writes, and version B will be active for GUI and REST writes.
The Data Versioning command opens first the Data Lock form.
The Data Lock form allows selecting a lock mode for the active version. Unlocked means writes are allowed on the active versions. Locked means all writes to the active versions of the data are disabled: provisioning, GUI or REST writes can be redirected to the standby versions. This allows for testing including provisioning even in a locked mode.
The Data Version Selection (left menu) opens the form by the same name. This form lists the services (databases) present on the system with their tables and allows:
- selecting the active version (Version A or Version B) for the call processing
- selecting for each writing mechanism (GUI, provisioning, REST) which version (Active or Standby) will be used.
Changes to the selections shown are possible only if the Data Lock above is set to Lock.
The Data Version Node Override (left menu) opens the form by the same name. This form lists the Call Processing nodes present on the system and allows overriding the default active version (defined in Data Version Selection above, first column) for any of the Call Processing nodes. This allows for example overriding the default version A and using version B of the data on one Call Processing node for validation, testing etc., while the other Call Processing node(s) keep using the default active version for normal operations.
The Versions Comparison (left menu) opens a page by the same name, showing for each service table the number of records in Version A and Version B. It is expected that the number of records differs between _a and _b tables, the purpose of Data Versioning being precisely to have versions with different data sets/records. You can transfer data between sides by clicking the "Copy A to B" or "Copy B to A" buttons. A new Job will be triggered for the operation.
SIP Agents Monitoring
The SRE can send OPTIONS messages towards SIP Agents (SIP servers) to check if they are up. This monitoring mechanism runs every 60 minutes for the SIP Agents under monitoring. It allows keeping an up-to-date record of the status (up or down) of the various SIP Agents being possible final destinations for a call.
In a service logic supporting call crank back, a SIP Agent Status node will check the status of the first possible destination / SIP agent: if it's down, the next destination SIP agent status is checked, and so on until a SIP Agent with an up status is found. Then the service logic routes the call towards this destination.
The SIP Agents Monitoring command displays a simple paginated list of the SIP Agents registered for monitoring.
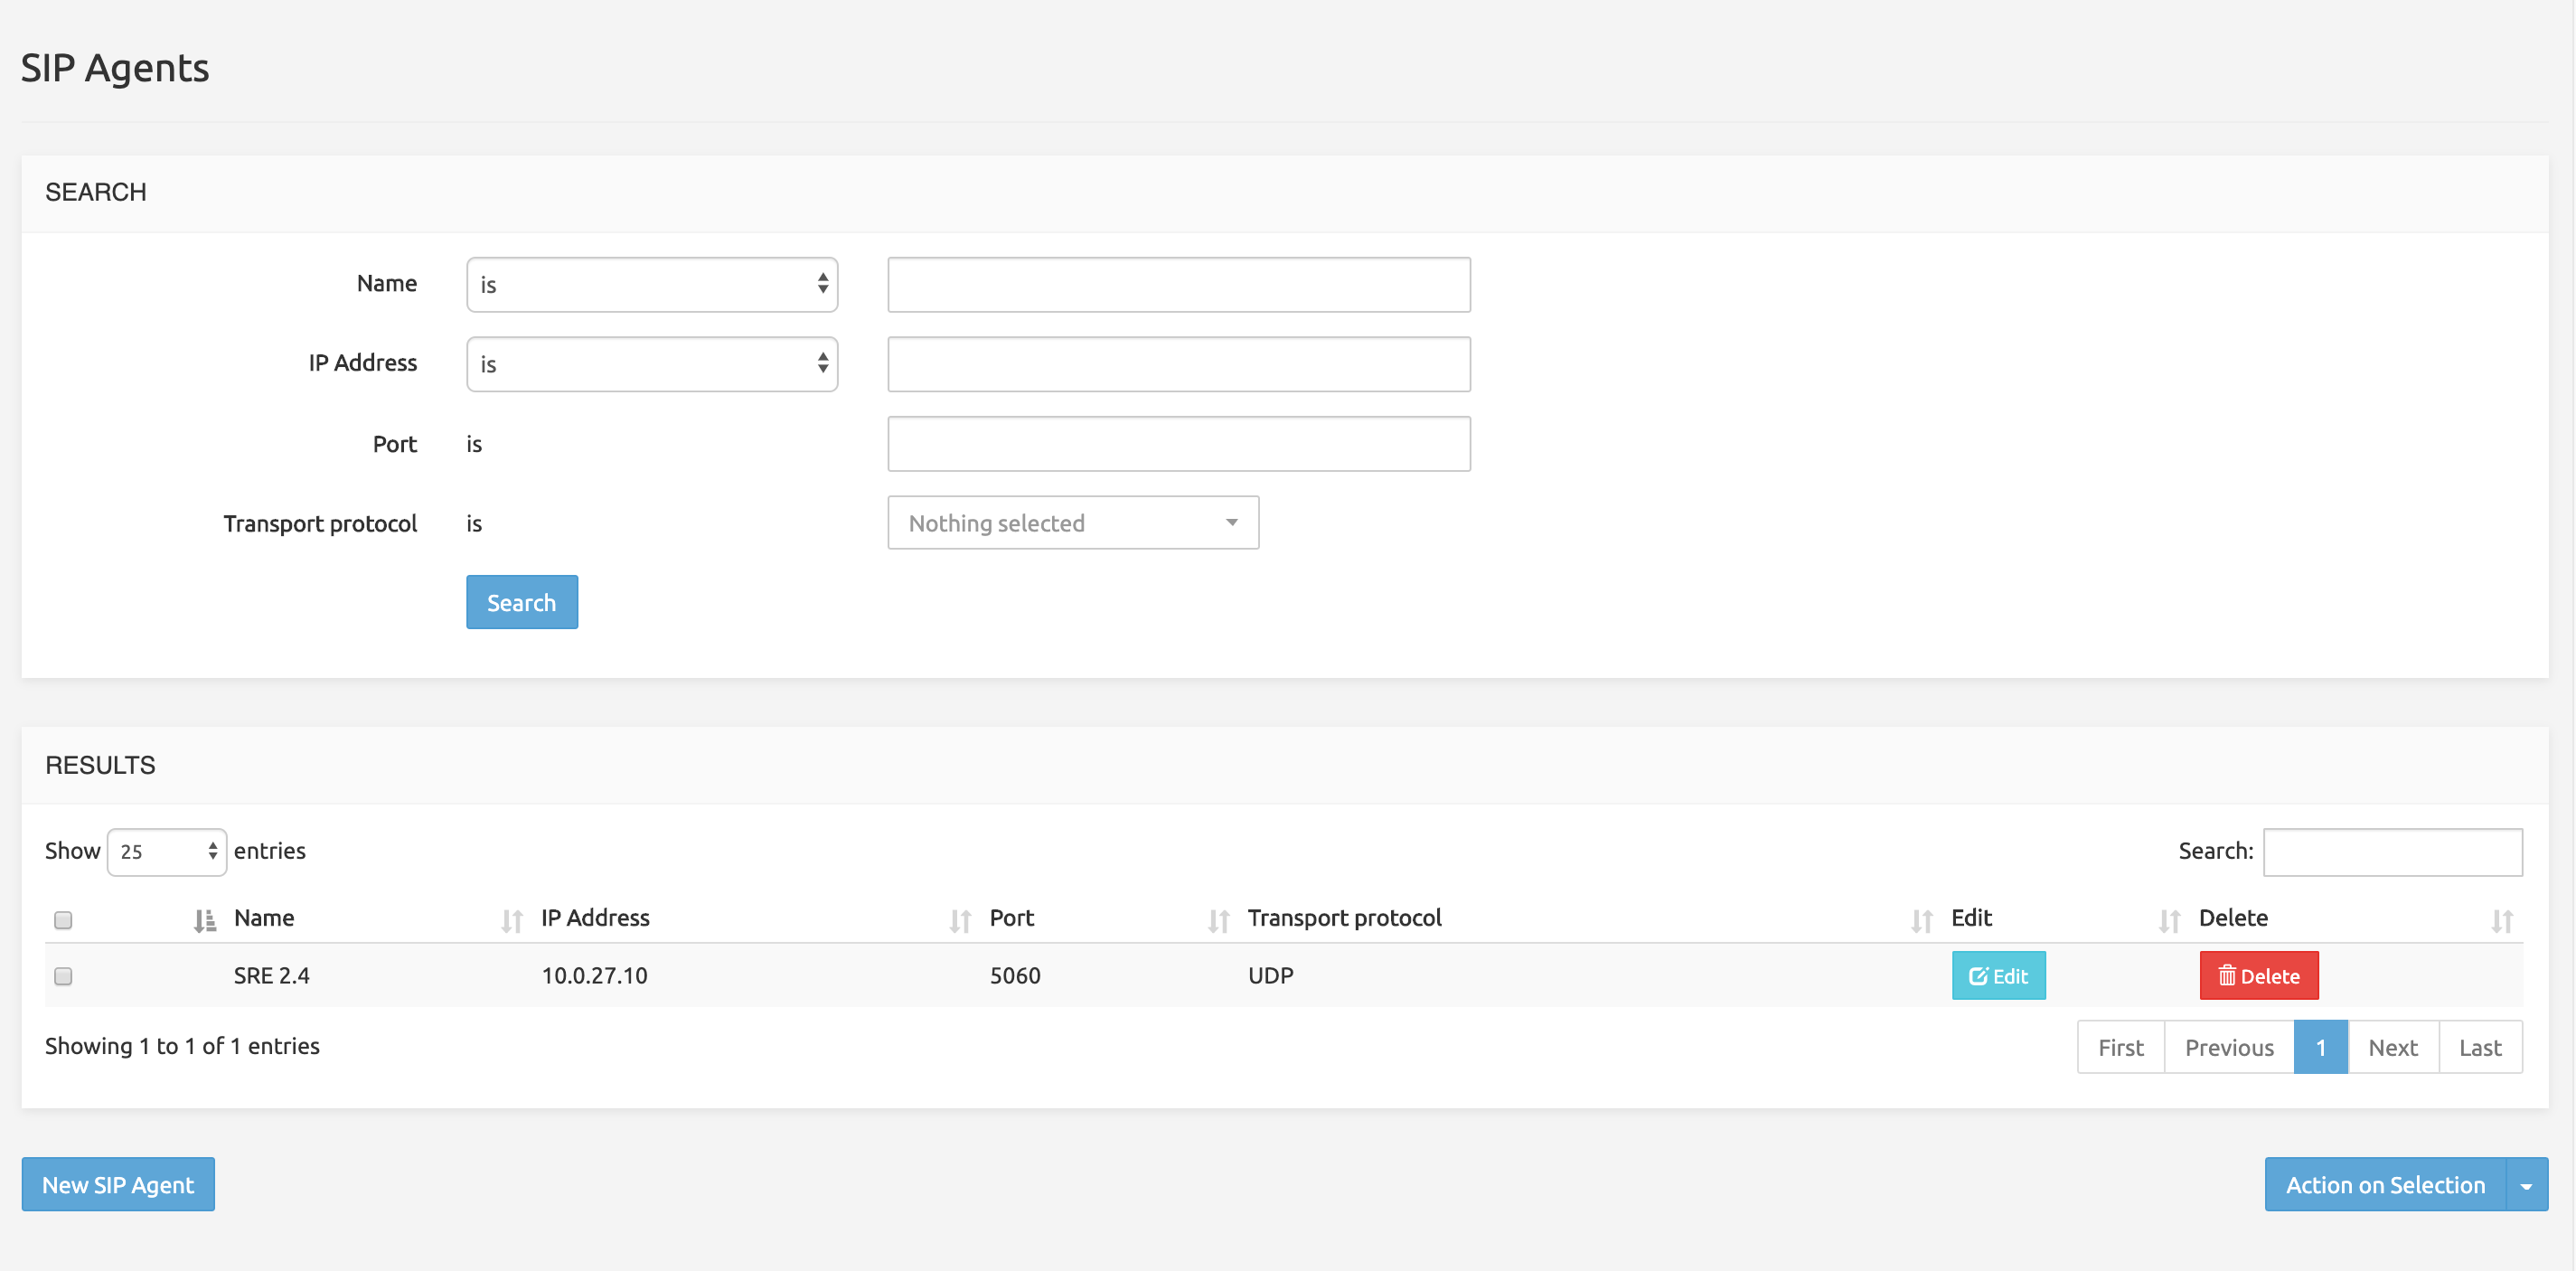
The Search field on the top right allows filtering the list with any string (digits or characters or both).
On each row, Edit and Delete buttons allow managing the entry.
- Edit opens an Edit Record form where the SIP server name, IP Address Port and Transport protocol may be changed.
- Clicking Delete will delete the record if the operation is confirmed (Yes/No? pop-up), but without Undo if Yes is selected.
The New SIP Agent button below opens a Create Record form with the SIP server name, IP Address Port and Transport protocol fields allowing to add a SIP Agent to monitor.
The Action on selection button displays a short menu allowing you to edit or delete the rows selected in the list (using the grey check-box on the left).
In case a more customized OPTIONS message is needed towards one or more SIP peer, a Custom Agent Probing feature is available using a special Service Logic. For more information, please refer to the SRE Service Logic Editor Manual.
SIP Remote Registration
SRE can act as a register client towards external SIP Proxies. After the initial REGISTER handshake, SRE will refresh periodically the registration.
This page displays a simple paginated list of the SIP Remote Registration currently activated:

The Search field on the top right allows filtering the list with any string (digits or characters or both).
On each row, Edit and Delete buttons allow managing the entry.
- Edit opens an Edit Record form to update registration details.
- Clicking Delete will delete the record if the operation is confirmed (Yes/No? pop-up), but without Undo if Yes is selected.
The New Remote Registrations button in the bottom left opens a Create Record form with the input fields fot the new record:
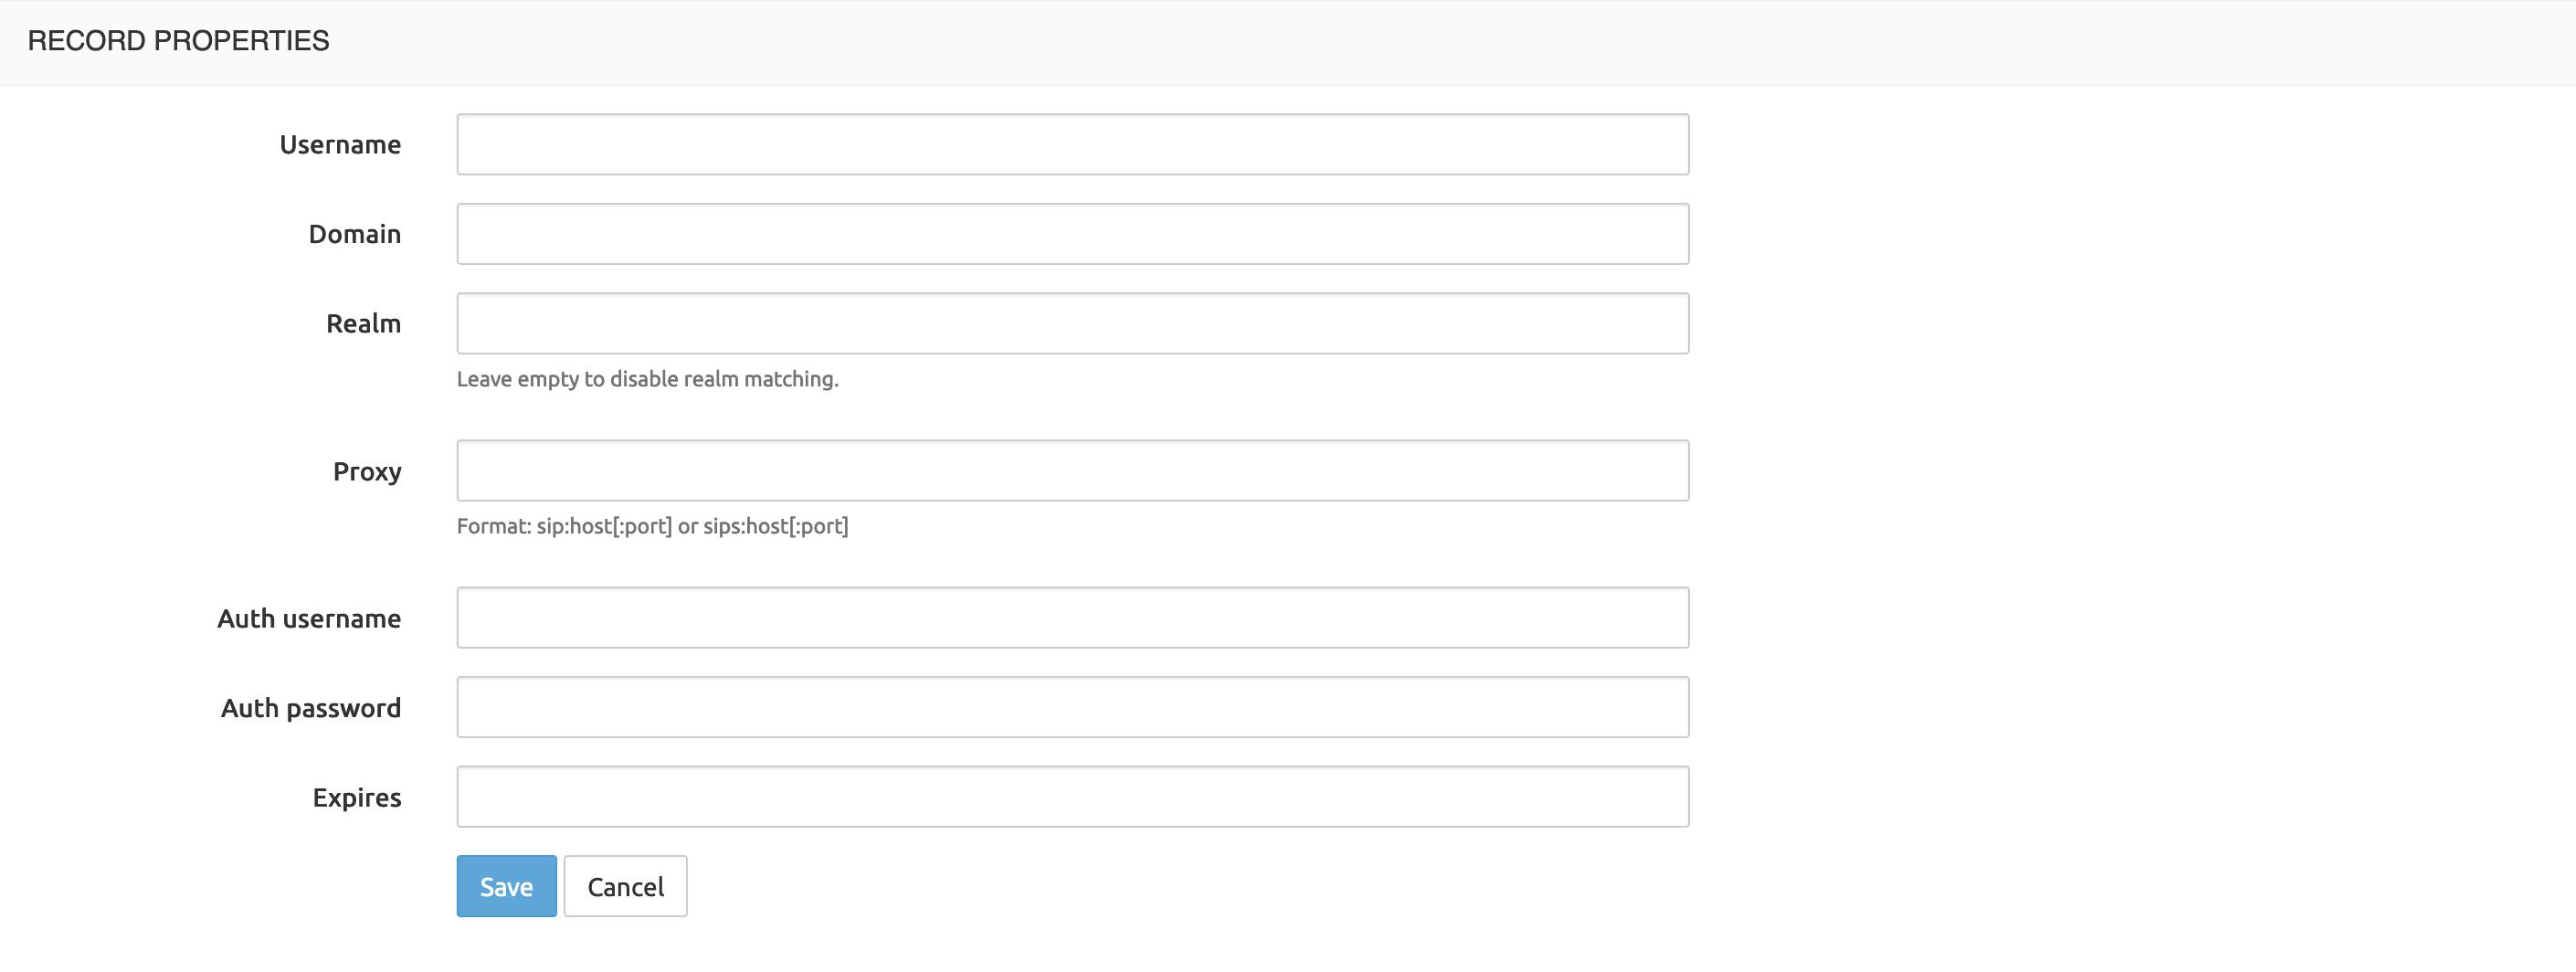
Description of the fields:
UUID: a unique identifier for the registration entry.
Username: username used in the From and To SIP header.
Domain: domain used in the From and To SIP header and request URI
Realm: realm to match. If empty realm matching is disabled.
Proxy: address of the registrar in the format
sip:host[:port]orsips:host[:port]Auth username: username for authentication
Auth password: password for authentication
Expires: value of the Expires header
INFO
Registration frequency is not affected by this value, it's configured by kamailio setting
REGISTER_INTERVALand is the same for all entries. By default is set to 1 minute.
The Action on selection button displays a short menu allowing you to edit or delete the rows selected in the list (using the grey check-box on the left).
Calls Monitoring
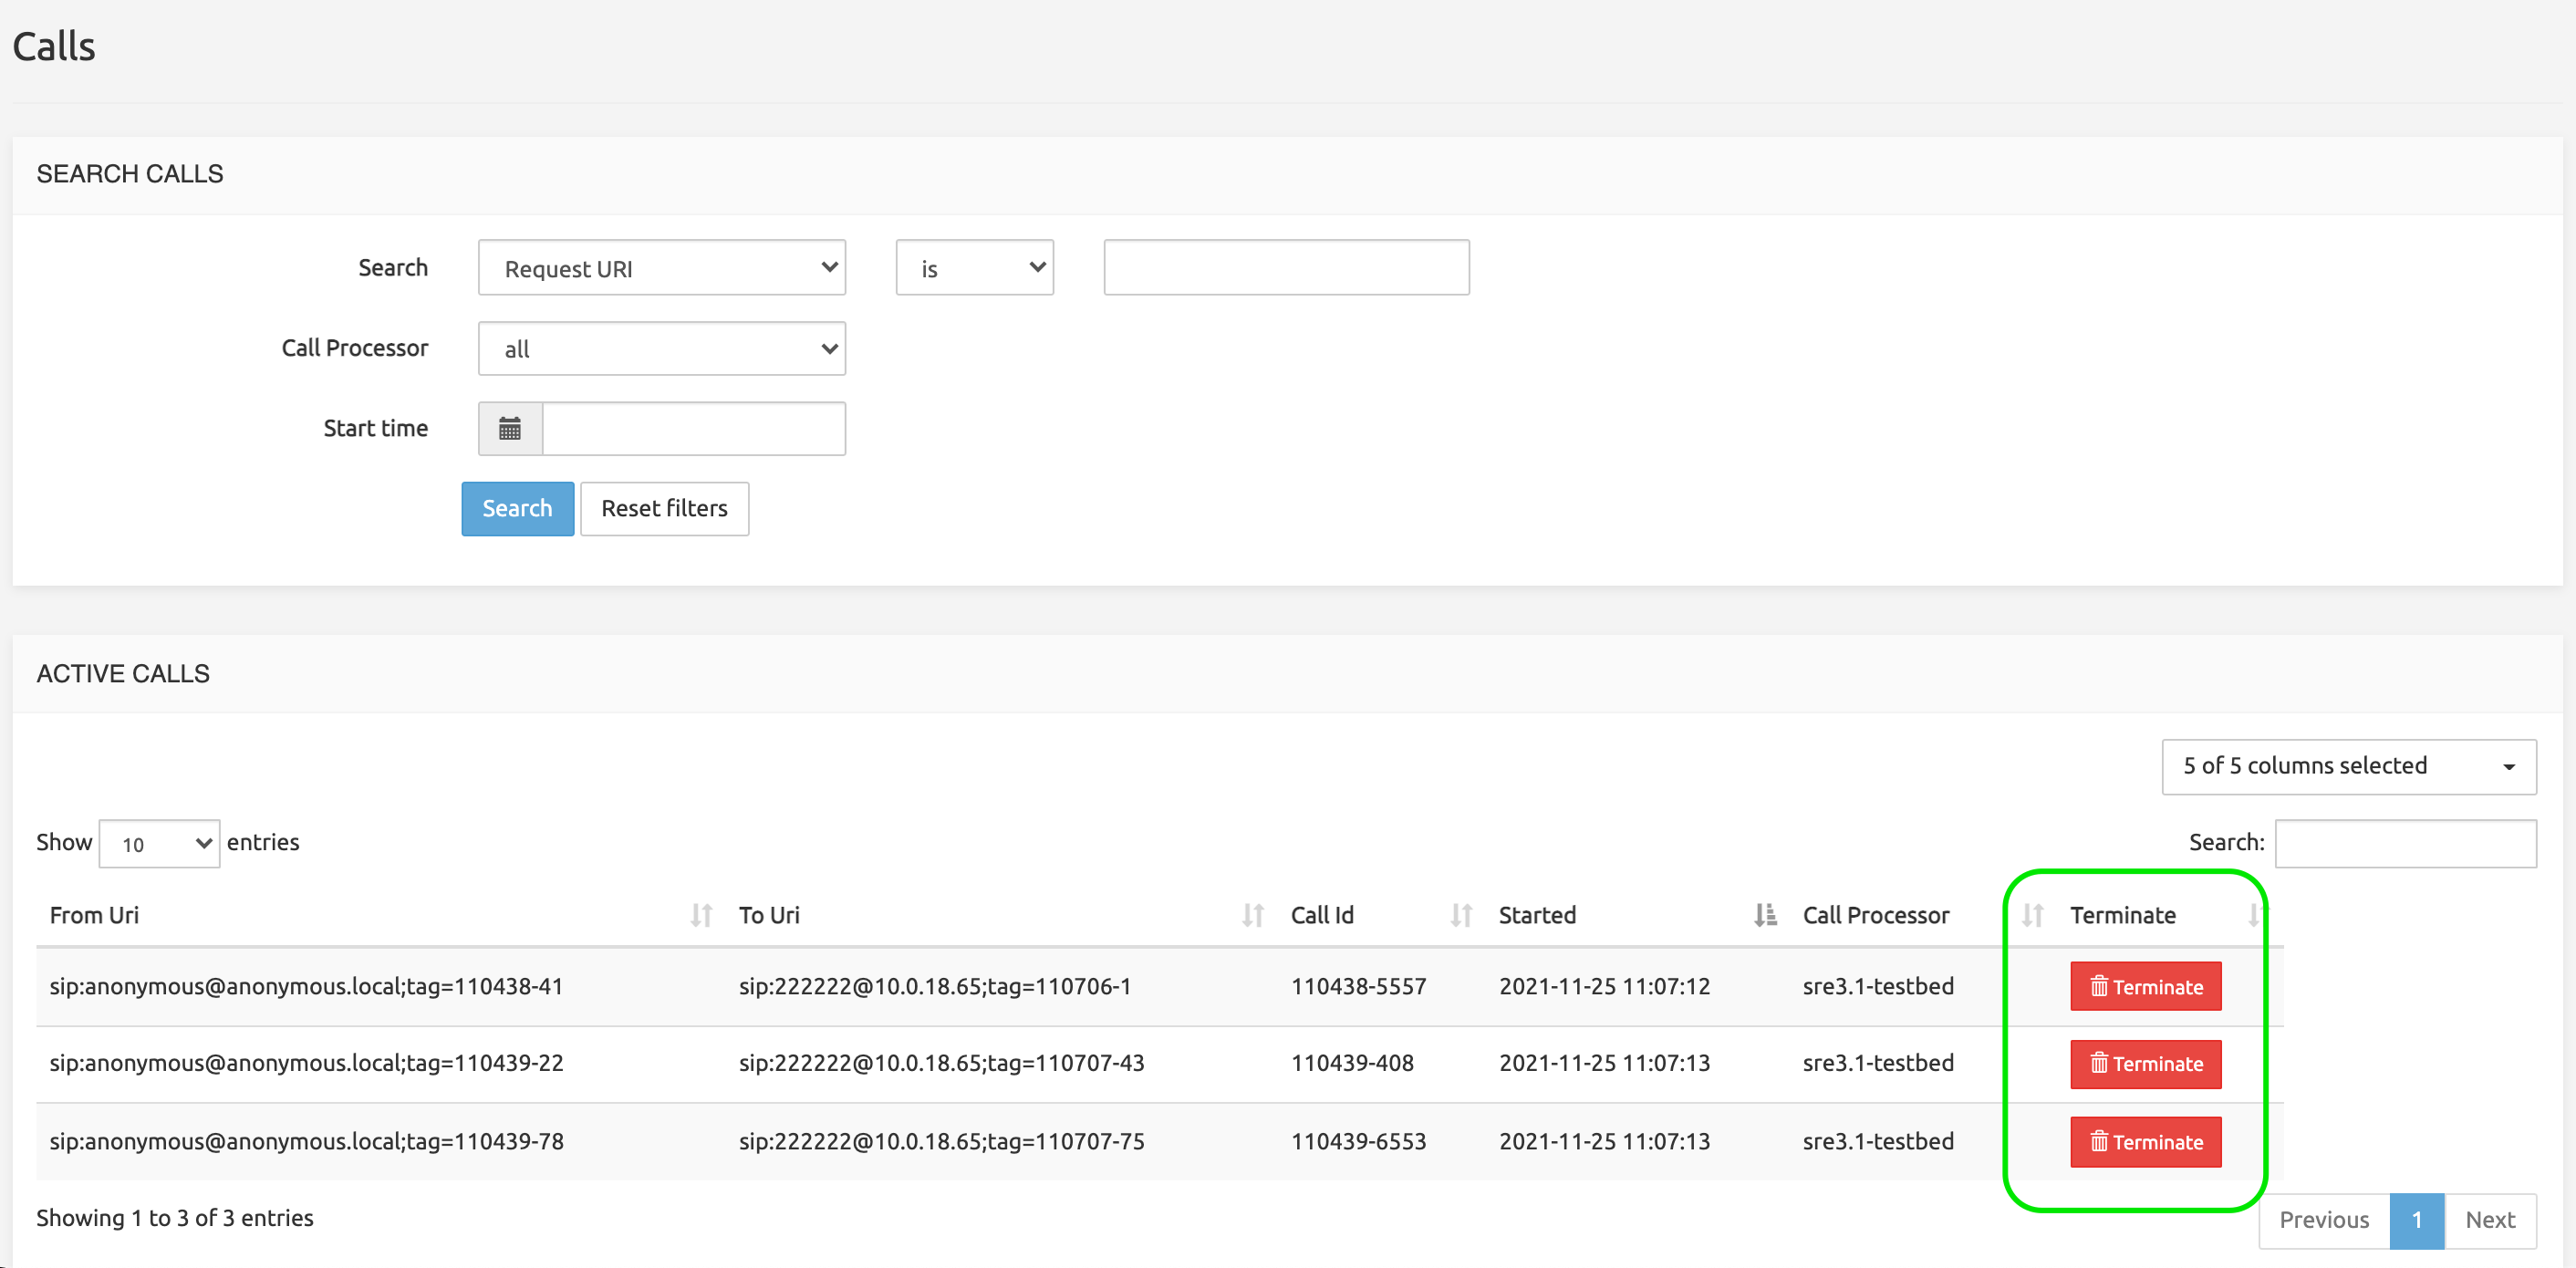
Under System > Calls Monitoring, the SRE Admin can look at the list of active calls in the system that match the criteria set in the System > Tracing menu (successfully connected and ongoing calls that SRE handles in Proxy mode).
Calls can be searched based on:
Request-Uri
From URI
To URI
Call-ID
Call Processing Node
Timestamp (range)
Note: this feature is only available when using Kamailio 5.4 or more recent.
The Active Calls list presents a Terminate button for each active call. When clicked, the Call Processing node handling the call will terminate the call by sending a BYE message on both sides of the dialog.
Tracing
A Tracing mode registering detailed service logic execution steps can be activated for specific calling or called numbers, or even for any number. The results of this Tracing are logged into the /var/log/sre/sre.log file. They are visible to the administrators through CLI commands displaying the contents of the log file.
The Tracing mode will log call details under the two following conditions:
The Call tracing service logic flow setting under System > Settings must be set to DEBUG. Any other level (from INFO to CRITICAL) would result in deactivating the Tracing mode globally.
Criteria for tracing numbers must be defined and activated in System > Tracing, as explained below.
The Tracing command in the System menu displays a two-section page, with a left panel listing the interfaces available for tracing.
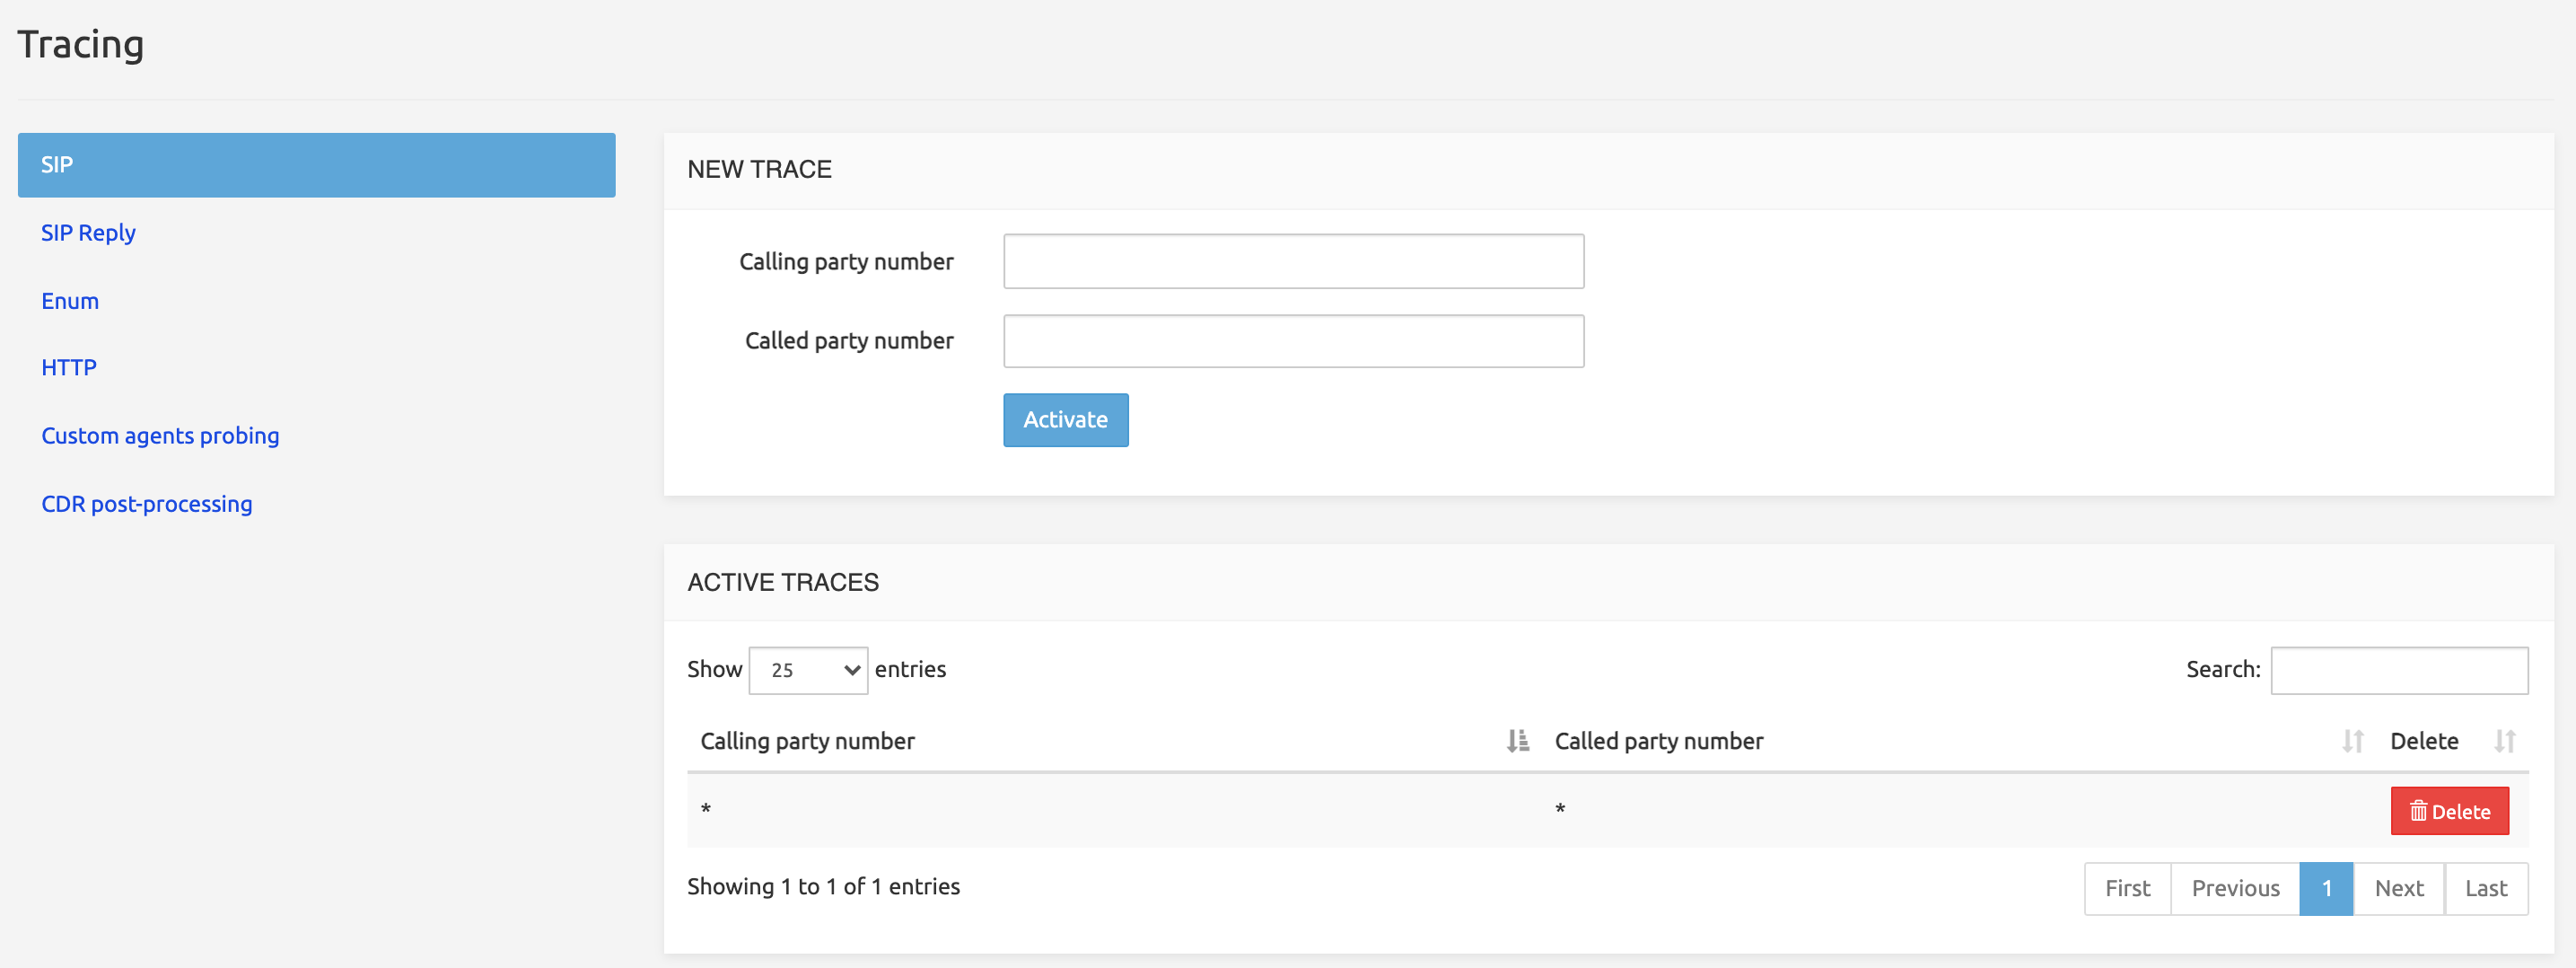
The top section, New Trace, allows specifying the criteria to use for tracing depending on the interface selected in the left panel (see below).
Note that a wildcard star (asterisk: *) is automatically appended to any sequence of digits entered in any of the fields. Entering '475' will result in activating the criterion 475*, which will trace any number starting with 475. Entering nothing will result in activating the criterion *, which will trace ALL numbers.
Click Activate to record both criteria and have the pair listed on one line in the section below.
The bottom section, Active Traces, lists the tracing criteria that have been activated in the section above. The Delete button cleans up the line.
Note that if a number matches several criteria, it will nevertheless be traced only once.
SIP
The SRE operator can enable tracing logs for calls matching specific calling / called ranges. They can be configured in System > Tracing, under the SIP tab.
Logs for calls that match the criteria will be then available in the Service Logic (tab Traces) that applies to the log. For instance, for live calls, in-gui tracing logs are available within the active Service Logic.
Once found the trace of interest, the User can click either on Call Descriptor (that will display input and output call descriptors), or on Show (which replays the simulation in the Service Logic and provides the full simulation including the Simulation Timeline view).
WARNING
The Tracing functionality has an impact on performances, therefore must be used carefully, by limiting as much as possible the amount of traced calls. By default, SRE is only tracing 100 calls and will override old traces once this limit is reached. The limit can be changed in System > Settings > GUI > Max number of traces stored in-memory (although this is not recommended for performance reasons).
Furthermore, built-in throttling protection in the system prevents tracing to affect the overall system availability.
SIP Reply
Based on the same criteria as SIP: calling and called number. The SRE operator can enable tracing logs for SIP Replies (180, 183, ...) matching specific calling / called ranges.
ENUM
Based on the phone number (range). The SRE operator can enable tracing logs for ENUM requests matching specific number ranges.
HTTP
Based on the URL of the HTTP command (for example GET /api/v1/trunks). The SRE operator can enable tracing logs on HTTP requests matching the URL.
Custom Agents Probing
Tracing logs are generated based on the number of iterations that must be executed before a trace is created (for example, set Iterations to 10 and a trace is created every 10 sip options are sent to the peers).
CDR Post-processing
Tracing logs are created for CDR post-processing based on From/To usernames set in this screen.
Alarms
The SRE permanently (every 4 seconds) monitors the conditions for the operations presented in the table below, and raises alarms when corresponding thresholds are reached.
All alarms are stored in a DB table named alarms, which is managed exclusively by the sre-manager. See below Managing alarms for more details.
Thresholds for the monitored operations (see table below) are defined in System > Settings > Alarms.
Four severity levels are used:
: a simple information message, not linked to any threshold
: raised when the minor threshold is reached
: raised when the major threshold is reached
: raised when the critical threshold is reached.
SNMP traps can be sent if SNMP traps receiver, community and port are configured in System > Settings > Alarms.
Monitored operations
The table below lists the operations that are under monitoring, together with their criticalities and messages.
+---------------+-------------------------+----------------------------+ | Monitored | Severity | SNMP messages | | operation | | | +===============+=========================+============================+ | System: | | | +---------------+-------------------------+----------------------------+ | CPU usage | minor, major, critical | 'cpuMinor', | | | (thresholds defined in | 'cpuMajor', | | | the GUI) | 'cpuCritical' | +---------------+-------------------------+----------------------------+ | Memory usage | minor, major, critical | 'memoryMinor', | | | (thresholds defined in | 'memoryMajor', | | | the GUI) | 'memoryCritical' | +---------------+-------------------------+----------------------------+ | Disks usage | minor, major, critical | 'diskMinor | | | (thresholds defined in | <mountPoint>', | | | the GUI) | 'diskMajor | | | | <mountPoint>', | | | | 'diskCritical | | | | <mountPoint>' | +---------------+-------------------------+----------------------------+ | Service | | | | Logic : SIP | | | | messages | | | | processing | | | | duration | | | | (p | | | | erformance) | | | +---------------+-------------------------+----------------------------+ | INVITE | minor, major, critical | \ | | | (duration threshold | 'invitePerformanceMinor', | | | defined in the GUI) | \ | | | | 'invitePerformanceMajor', | | | | 'i | | | | nvitePerformanceCritical' | +---------------+-------------------------+----------------------------+ | REGISTER | minor, major, critical | idem | | | (duration threshold | (registerPerformanceMinor, | | | defined in the GUI) | ...) | +---------------+-------------------------+----------------------------+ | OPTIONS | minor, major, critical | idem | | | (duration threshold | (optionPerformanceMinor, | | | defined in the GUI) | ...) | +---------------+-------------------------+----------------------------+ | Service | | | | Logic: Error | | | | during node | | | | execution | | | +---------------+-------------------------+----------------------------+ | Error | info | | +---------------+-------------------------+----------------------------+ | Jump | info (jump to next node | | | | failed) | | +---------------+-------------------------+----------------------------+ | Supervisord | | | | : process | | | | responsible | | | | for automatic | | | | launch and | | | | relaunch of | | | | processes | | | +---------------+-------------------------+----------------------------+ | process | critical | 'processStopped | | stopped | | <processName>' | +---------------+-------------------------+----------------------------+ | process | info | 'processStarting | | restarted | | <processName>' | | less than 5 | | | | seconds ago | | | +---------------+-------------------------+----------------------------+ | SIP Agents | | | | : | | | +---------------+-------------------------+----------------------------+ | agentDown | info | 'sipAgentDown <name> | | | | <address> <port> | | | | <UDP or TCP>' | +---------------+-------------------------+----------------------------+ | agentTrying | info | 'sipAgentTrying <name> | | | | <address> <port> | | | | <UDP or TCP>' | +---------------+-------------------------+----------------------------+ | agentUp | info | 'sipAgentUp <name> | | | | <address> <port> | | | | <UDP or TCP>' | +---------------+-------------------------+----------------------------+ | DB | | | | Replication | | | | : | | | +---------------+-------------------------+----------------------------+ | disconnected | critical | 'rep | | | | licationNodeDBDisconnected | | | | < | | | | replicationMachineName>' | +---------------+-------------------------+----------------------------+ | connected | info | ' | | | | replicationNodeDBConnected | | | | < | | | | replicationMachineName>' | +---------------+-------------------------+----------------------------+ | Lag (lag | minor, major, critical | 'replicationLagMinor', | | between write | (duration threshold | 'replicationLagMajor', | | on master and | defined in the GUI) | 'replicationLagCritical' | | write on | | | | slave) | | | +---------------+-------------------------+----------------------------+ | Missing | | | | CDRs: | | | +---------------+-------------------------+----------------------------+ | Missing CDR | critical | 'missingCDR' | | | | | | | | The system produces this | | | | alarm when no CDR is | | | | produced during an | | | | interval specified in | | | | System > Settings > | | | | Alarms > Check interval | | | | for cdrs (mins). | +---------------+-------------------------+----------------------------+
Viewing alarms
Alarms are presented to SRE administrators in two places: notifications in the main SRE banner and the Alarms page accessible through System > Alarms.
INFO
The SRE raises alarms when thresholds are reached for the above listed operations. As soon as the situation is back to normal, the system automatically clears the corresponding alarm (see Clearance below). Manual clearance is possible, but it does not fix the situation that has caused the alarm: if a node or a SIP Agent is down or if a process is stopped, manually clearing the alarm will not restore connections or restart processes.
Alarm notifications
Alarm notifications appear in the four squares on the right in the main SRE banner, one square for each severity from info to critical.

Only active alarms are counted in the number displayed. Clicking on any square opens the Alarms page with the appropriate filters: alarm status is « Active », alarm severity is any of the four severities depending on the square clicked.
The picture below shows the Alarms page when the « critical » square (3) has been clicked. The 3 active critical alarms are listed on this page.
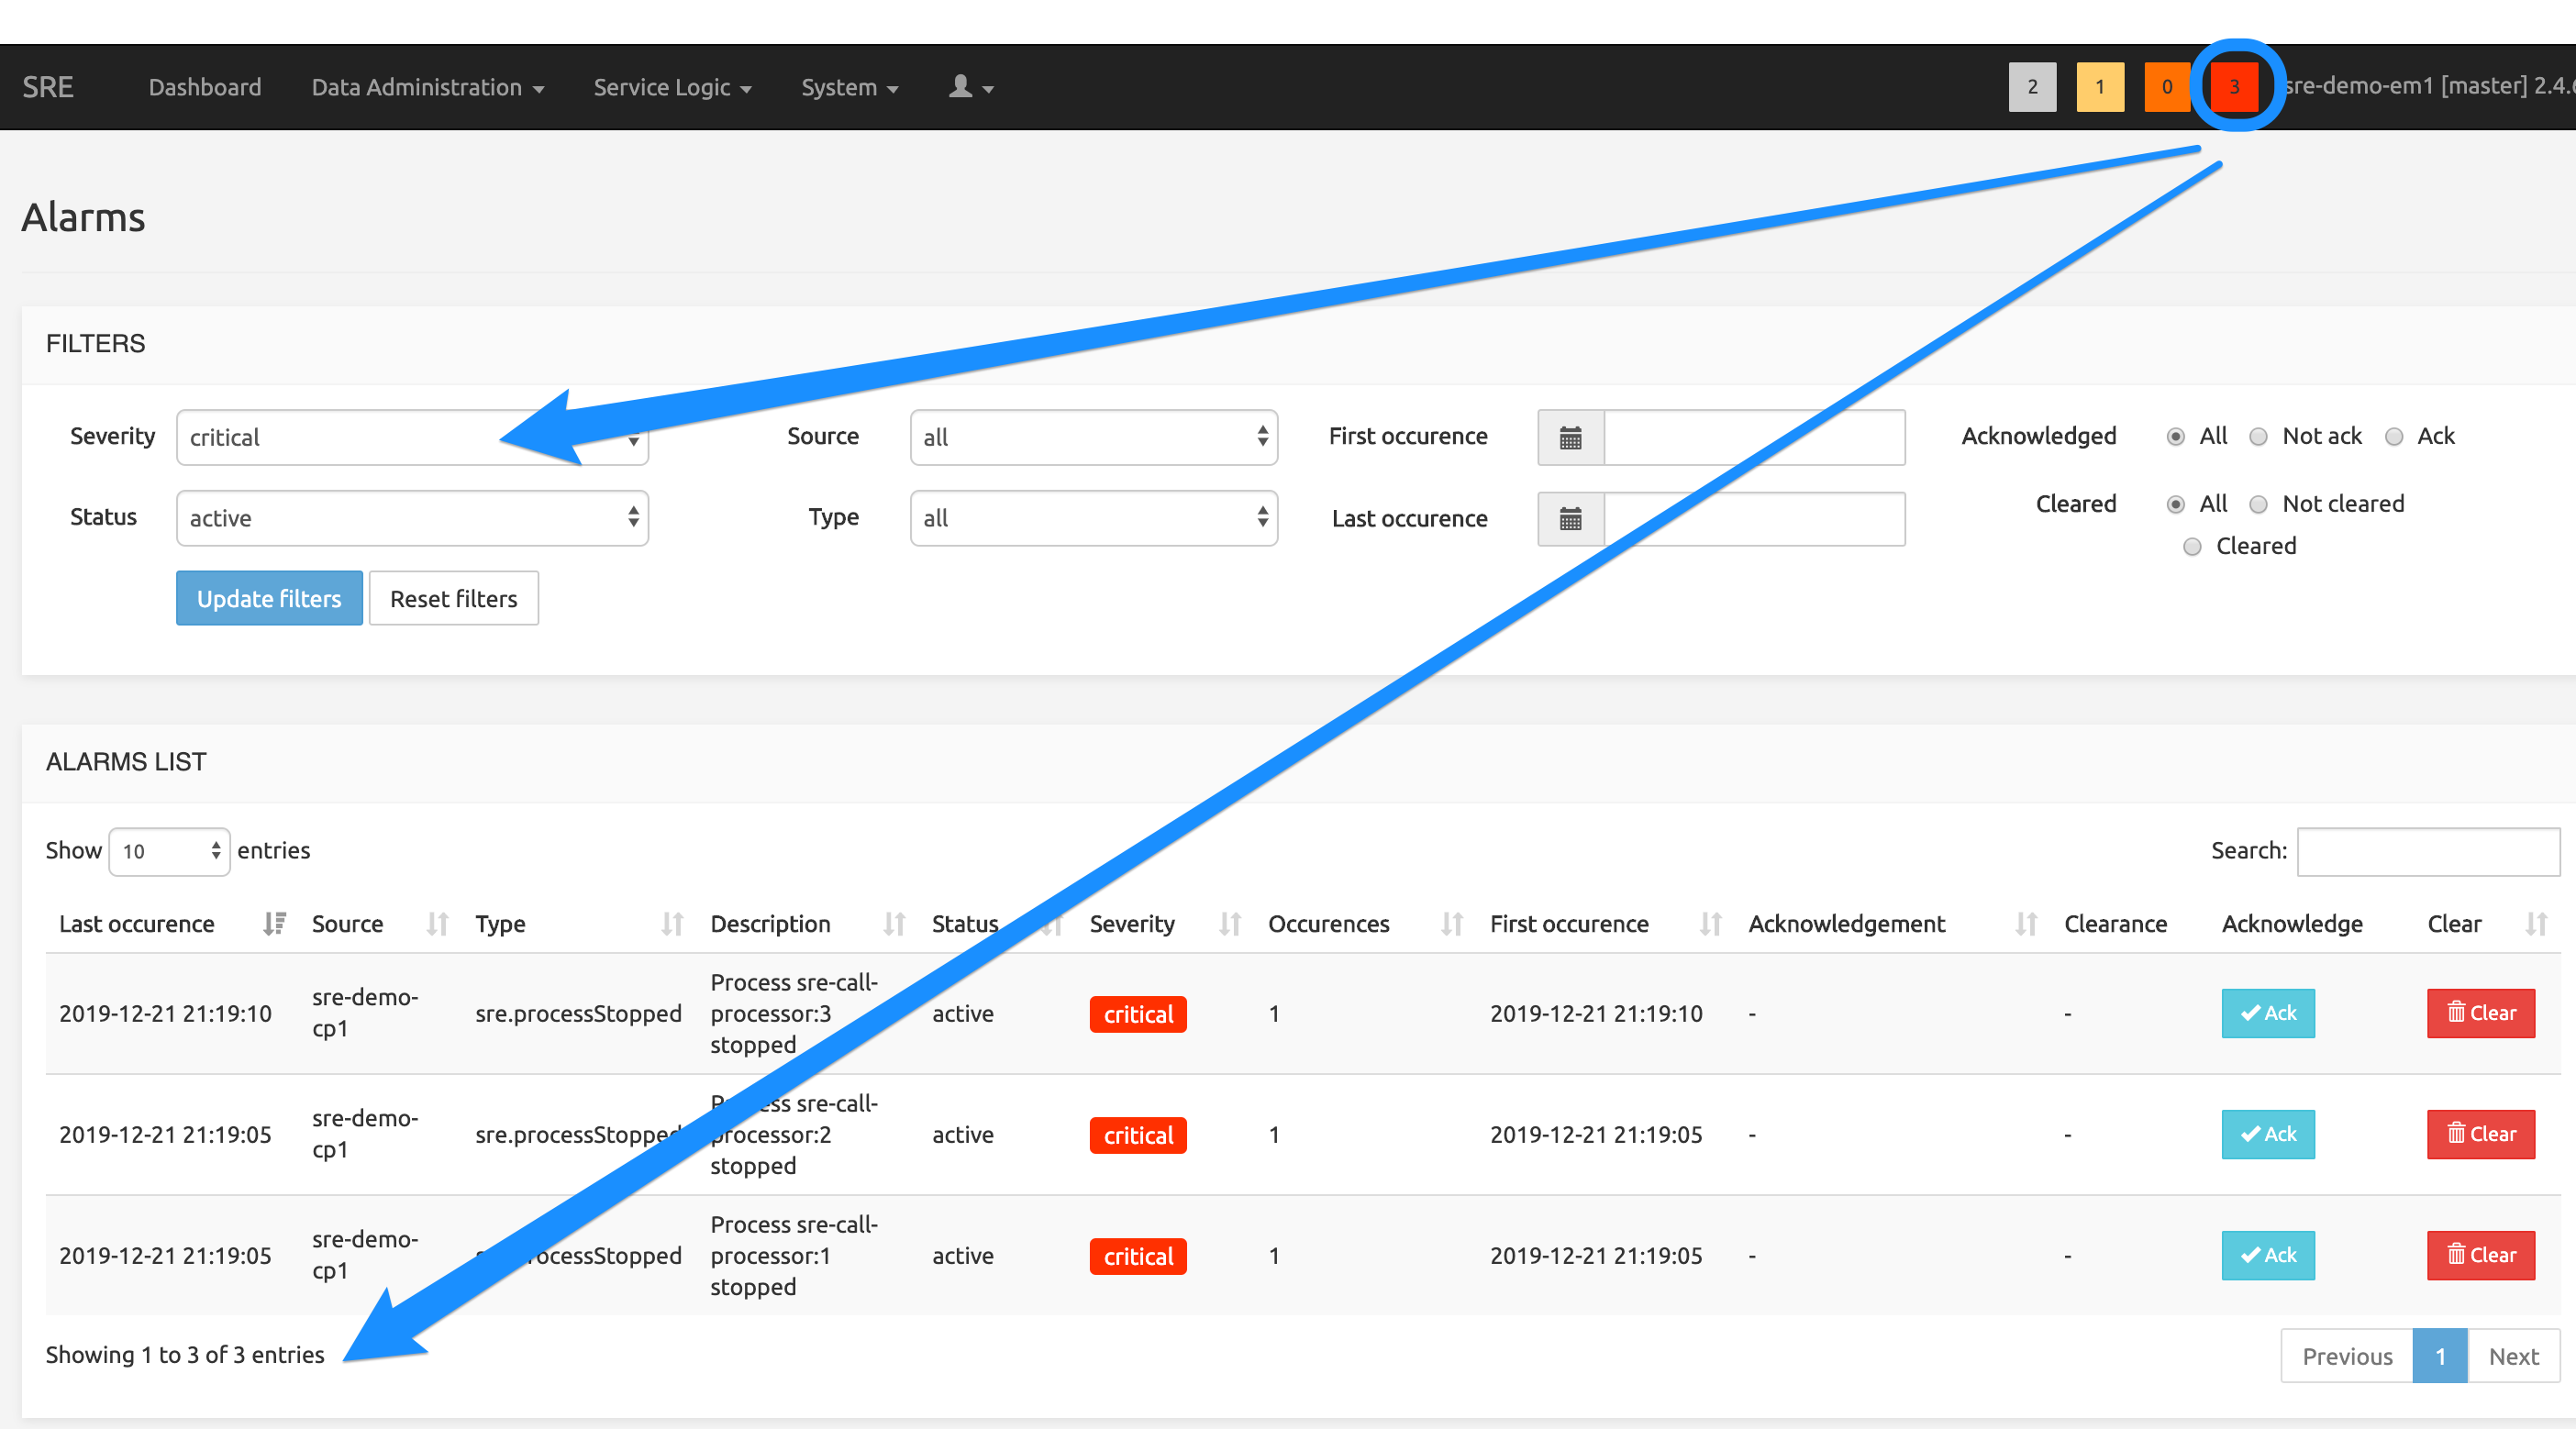
Alarms page
From the System menu entry in the main menu bar, selecting Alarms displays the Alarms page with default filters, retrieving all alarms recorded in the DB.
INFO
This can take some time if the number of stored alarms is important. We recommend opening the page from one of the notifications squares instead and then adjusting filters to get the desired list.
The FILTERS section allows specifying the following criteria:
Severity: all levels or any level from
infotocriticalStatus: all statuses or any status of
active,user-cleared,system-cleared(see Managing alarms below).Source: all nodes or any of the EM nodes and CP nodes present in the system.
Type: all alarm types or any of the types (see table Monitored operations above).
INFO
Only the types present in DB for the Severity filter already selected are listed, i.e. alarm types for which no alarm has been raised do not show in the list -- querying the DB on non-existing alarms is useless.
First and last occurrence: starting and ending dates for the desired time window to query.
Acknowledged: all alarms (acknowledgement ignored), or only the acknowledged ones, or only the not acknowledged ones (see Managing alarms below).
Cleared: all alarms (clearance ignored), or only the cleared ones, or only the not cleared ones (see Managing alarms below).
When all filters have been set as desired, click the Update filters button to refresh the list of alarms. Note that clicking Reset filters clears up all filters and queries the DB using default filters (all alarms, of all severities, statuses, sources and types: see Note above).
The ALARM LIST section returns the alarms matching the criteria selected above. The usual Search field and navigation controls are available.
The Description field provides details about the situation that has raised an alarm.
The Occurrences field marks recurrent alarms. An alarm is considered recurrent (and the number of occurrences is incremented) when a threshold is again reached for an alarm already existing in DB, for the same source with the same type and severity, in the active state (not system- or user-cleared) and the new alarm occurs after the delay set in Settings / Alarms / Alarms recurrence window (default: 60 secs).
Would the new alarm occur within the 60 secs recurrence time window, it would just be ignored (to avoid a useless increase of alarm-related data). After the 60 secs delay, a new alarm (for the same source with the same type and severity) would be created only if the state of the existing alarm(s) is not active.
The two columns Last occurrence and First occurrence show the time and date of the last and first occurrences of the alarm. If the number of occurrences is 1, they are identical. If it is > 1, the comparison of the two values gives an indication of the time elapsed between the first and last occurrence (5 days in the example below, during which the alarm occurred 6 times).

Managing alarms
SRE alarms record situations when a threshold is reached. User management of alarms is limited to two actions through the Ack and Clear buttons on each line of the list:
- Acknowledgment: clicking the Ack button changes the status from
not acktoackand stores the action's time, date and user ID. This shows other administrators that one operator has seen this alarm. This action cannot be reverted (no un-ack). - Clearance: the system automatically clears up most alarms as soon as the monitoring measurement shows that the threshold is not reached anymore. The status changes from
activetosystem-clearedand the time and date of the clearance are stored. Active alarms can also be cleared manually by clicking the Clear button: the status changes fromactivetouser-cleared. The time, date and user ID are stored. This action, be it system- or user-applied, cannot be reverted (no un-clear).
It is not possible to delete an alarm record from the table. An internal mechanism automatically purges the eldest records when the table's size reaches the limit.
Jobs
The Jobs command displays a list of the jobs executed. Two panes are present one-shot jobs and scheduled jobs.
One-shot jobs are triggered by the Datamodel module: Import CSV, Export CSV, Backup datamodel definition, and Restore datamodel definition actions.
Scheduled jobs are triggered automatically by SRE for internal maintenance, such as old cdr purging, automatic database backup, log rotation etc.

Each job has a Job Information link (text in caps).
Clicking this link displays a Details window showing the operations performed, as shown for Export CSV job in the picture above.
When a file is saved on the SRE server (.dump file for backup, .csv file for data export), a link to the file (in blue) is shown below the Job Information list. These files can be downloaded locally for various purposes.
INFO
Exported datamodels are not stored on the SRE server but saved locally in a location accessible to the user for later import. They are thus not listed in this Jobs list.
Logs
The Logs page displays a Log Viewer application, showing data from SRE local log files.
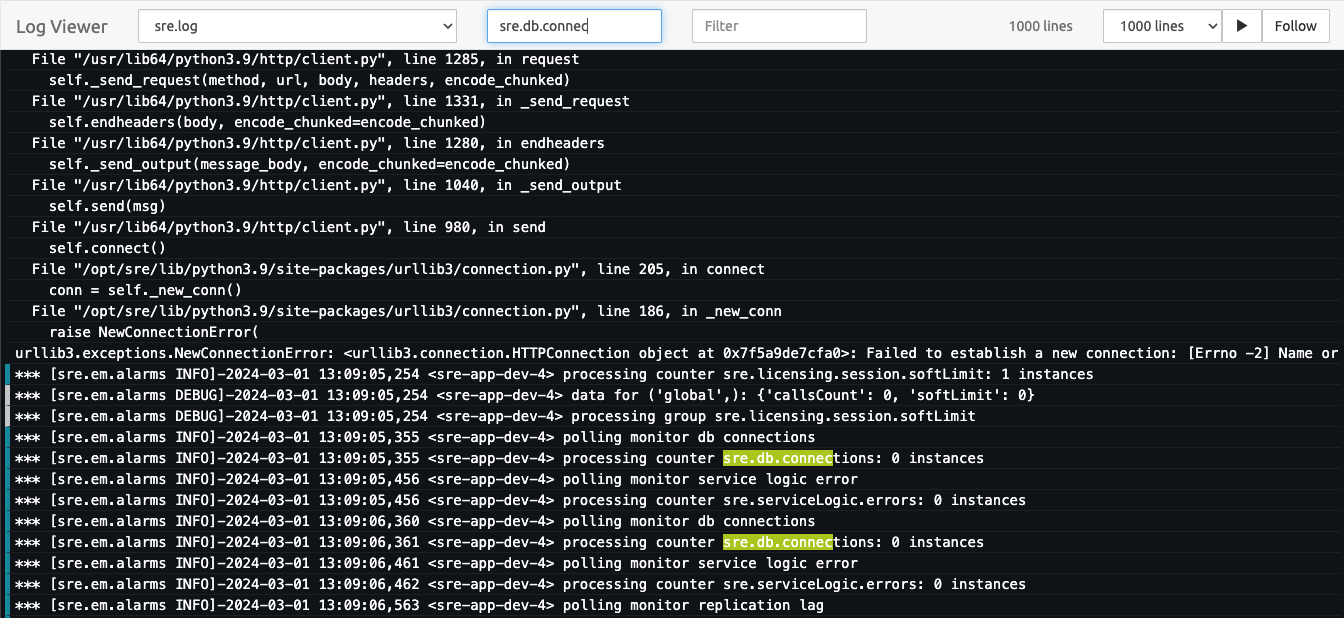
The top bar of the "Log Viewer" application contains the following elements:
File name selection
- dropdown to select the log file to display.
Highlight field
- text placed in this field will be highlighted in the output.
Filter field
- the user has the option to filter log entries containing the entered text.
Maximum lines field:
- used to select the maximum number of log lines to be displayed at once. Setting an high value can slow down your browser.
Pause/Play button:
- used to pause/restart the automatic updating when new log lines are added.
Follow button
- when selected automatically scroll to the end of file.
Help
The menu contains links to various documentation and tools related to SRE. The options include:
- Product Description: Provides an overview or detailed description of the product.
- Administration Guide: Offers guidance on managing and configuring the system.
- Service Logic Editor: Opens documentation on how to use the Service Logic Editor.
- Nodes Description: Explains the nodes available for a service logic.
- Alarms: Provides information or tools to manage system alarms.
- REST APIs: Reference for using the product's REST APIs.
- Operations & Monitoring Guide: A guide focused on operating and monitoring the system.
- Generate support info: Generate a snapshot of system logs and other support-related information for troubleshooting. When ready the file can be downloaded from the Jobs page.
SRE Logs and Processes
This Appendix describes SRE log files and processes (and daemons) and their usage.
SRE Log files
The SRE logs some information in the following log files. All are located in /var/log/sre.
accounting.log: on EM nodes, logs CDRs recorded in cdr filesinterface.log: on CP nodes, logs communication between Kamailio andsre-brokerservice-logic-execution.log: on EM nodes, logs the traces of Service Logic executionsre.log: on all nodes, logs general messages from the SRE platform. This file stores log information from the following sub-logs:- Service orchestrator log
- GUI data administration log
- GUI service logic editor log
- Batch CSV uploads log
- EM node control log
- CP node control log
- SIP agents probing log
- Alarms log level
sre-gui.out.log: on EM nodes, logs GUI related operations, such as login/logout, access to SRE GUI pages, alarm tab refresh, etc.audit.log: audit logs moved away from the general logging ofsre-gui. They are enhanced to provide more information such as:- Login attempts successful/unsuccessful from a user (logging username and source IP address)
- Operations done at Service Logic level (edit SL, open SL)
- Operations done at the Data Model level (edit DM, save DM, activate DM version)
- Operations done in general Settings
- Any other operation in the System menu
Log level can be set for each log through Settings>Log levels, according to standard Python Logging Levels (from Debug to Critical). For more information, see https://docs.python.org/3/library/logging.html#logging-levels.
Managing SRE processes
SRE software processes are controlled by the supervisord daemon. The service name to start, stop and request status of the SRE software is sre.
Besides these standard service operations, it is possible to connect directly to the running supervisord instance by launching directly /opt/sre/bin/supervisorctl. Once connected to supervisord, several commands are available, as shown with the help command:
    supervisor> help

    default commands (type help <topic>):
    =====================================
    add    exit      open  reload  restart   start   tail
    avail  fg        pid   remove  shutdown  status  update
    clear  maintail  quit  reread  signal    stop    version
The current status of the processes can be obtained by using the status command.
    supervisor> status
    sre-call-processor                         STOPPED   Not started
    sre-gui                                    RUNNING   pid 3014, uptime 0:08:55
    sre-manager                                RUNNING   pid 3005, uptime 0:08:55
On start, supervisord reads the configuration file /opt/sre/etc/supervisord.conf to select which programs must be started. It is possible to overrule this configuration by manually starting or stopping processes.
A single process can be restarted with the restart <program> command.
    supervisor> restart sre-manager
    sre-manager: stopped
    sre-manager: started
A single process can be stopped with the stop <program> command.
    supervisor> stop sre-manager
    sre-manager: stopped
A single process can be started with the start <program> command.
    supervisor> start sre-batch-provisioning-all-broadcast
    sre-batch-provisioning-all-broadcast: started
The supervisord configuration can be reloaded with the reload command. This operation stops all the processes and they are restarted according to the supervisord configuration file. In particular, if a process has been manually started while it is not active in the configuration, this process will not start after the reload operation.
    supervisor> reload
    Really restart the remote supervisord process y/N? y
    Restarted supervisord
It is possible to read what a process outputs on its standard output with the tail <program> command:
    supervisor> tail sre-batch-provisioning-customer
    Data is locked: exiting
EM Processes
sre-gui
The daemon process sre-gui is responsible for exposing the Web GUI to administrators. It collects stats from the sre-manager process to display them in the GUI.
The default listening port is 8080 and can be changed in System>Settings >GUI.
sre-manager
The daemon process sre-manager is responsible for collecting on ZeroMQ sockets information from the different nodes:
- logs
- stats
- heartbeats and status info.
sre-broker
The process sre-broker is responsible for communication between Kamalio and sre-call-processor processes, and ultimately to the sre-manager and sre-gui processes.
sre-admin-logging
The process sre-admin-logging is a CLI-based utility to set the log level for the different log channels used in the SRE system. These changes are broadcasted to the different nodes.
sre-admin-tracing
The process sre-admin-tracing is a CLI-based utility to activate traces for specific calling or called numbers. These trace activations are broadcasted to the different CP nodes.
sre-batch-provisioning
The process sre-batch-provisioning is responsible for processing data from CSV or XML files and provisioning the database with the parsed data.
The process can either be called with a single file as the argument or with an option to indicate to run in daemon mode. When in daemon mode, it scans specific directories for each type of CSV or XML upload and process the files to provision the database.
sre-cdr-collector
The process sre-cdr-collector is introduced in release 3.2 and is responsible for collecting accounting events information from the corresponding sre-cdr-sender running on the CP nodes, and producing CDR files.
sre-scheduler
The process sre-scheduler is introduced in release 4.0 and on EM is responsible for running internal maintenance tasks.
CP Processes
The complete list of processes is not available at the time of writing. This section is therefore not exhaustive.
An example of an additional process is the one which will be in charge of communicating with the EM (receiving the orders from the EM, sending statistics and logs to the EM, and so on.)
sre-call-processor
The daemon process sre-call-processor exposes an HTTP interface and routes the JSON request to execution methods. These methods implement the service logic needed to handle calls.
For performance and load balancing reasons, the supervisor.d launches several instances of the sre-call-processor process (up to the number of CPUs or cores present on the server). Each process has max 10 threads ; here again, a load balancing mechanism spreads the load over the available threads.
sre-agents-monitor
The sre-agents-monitor is responsible for sending SIP OPTIONS messages to the SIP servers configured in SIP Agents tab. It is also responsible for probing external servers to check if they are still up.
sre-cdr-sender
The process sre-cdr-sender is introduced in release 3.2 and is responsible for pushing accounting events information to the corresponding sre-cdr-collector running on the EM nodes, and produce CDR files.
sre-scheduler
The process sre-scheduler is introduced in release 4.0 and on CP is responsible for running internal maintenance tasks and for scheduling periodic service logic execution if configured.
List of Acronyms
Lines in bold in the table below define SRE-specific acronyms.
| Acronym | Expansion |
|---|---|
| API | Application Programming Interface |
| CLI | Command Line Interface (or Interpreter) |
| CP | Call Processor |
| CSV | Comma Separated Value(s) (database export/import format and file extension) |
| DB | Database |
| EM | Element Manager |
| GUI | Graphical User Interface |
| ID | Identification/Identity/Identifier |
| IP | Internet Protocol (address) |
| REST | REpresentational State Transfer |
| SBC | Session Border Controller |
| SIP | Session Initiation Protocol |
| SLE | Service Logic Editor |
| SNMP | Simple Network Management Protocol (or: -- Monitoring Protocol) |
| SRE | Session Routing Engine |
