
Introduction
SRE gives operations teams a view of the platform and of the services running on it: what traffic is handled, how fast, which peers are reachable, what went wrong and why. The SRE Product Description explains where monitoring fits in the overall solution.
This document describes how monitoring and observability work in practice: the dashboard, the statistics framework, alarms and notifications, SIP agent monitoring, logging, call tracing, the events log and audit trail, and the tools available to support teams. It ends with an example of a service that reports the failure of a partner API.
All these features are part of SRE and do not require an add-on licence from the licensing table in the SRE Product Description.
How Monitoring Data Flows
Every node of the platform reports to the Element Managers:
- Call Processors count requests, responses and service logic executions, measure their duration, and send these statistics, together with logs and call traces, to the Element Managers.
- A health monitor runs on every node. It regularly reports the state of the SRE processes, CPU, memory and disk usage, database connection and replication status, MongoDB and cluster status, the SIP stack (memory and receive queue), media servers and the statistics database.
- The Element Managers consolidate this information, evaluate the alarm conditions, store statistics in the statistics database and present everything in the GUI.
The same information is available outside the GUI: alarms as SNMP traps and e-mails, logs as files or syslog streams, and a global status through the command-line administration tool.
Dashboard
The dashboard is the entry point for day-to-day monitoring. It is organised in tabs, each visible according to the access rights of the user's role:
| Tab | Content |
|---|---|
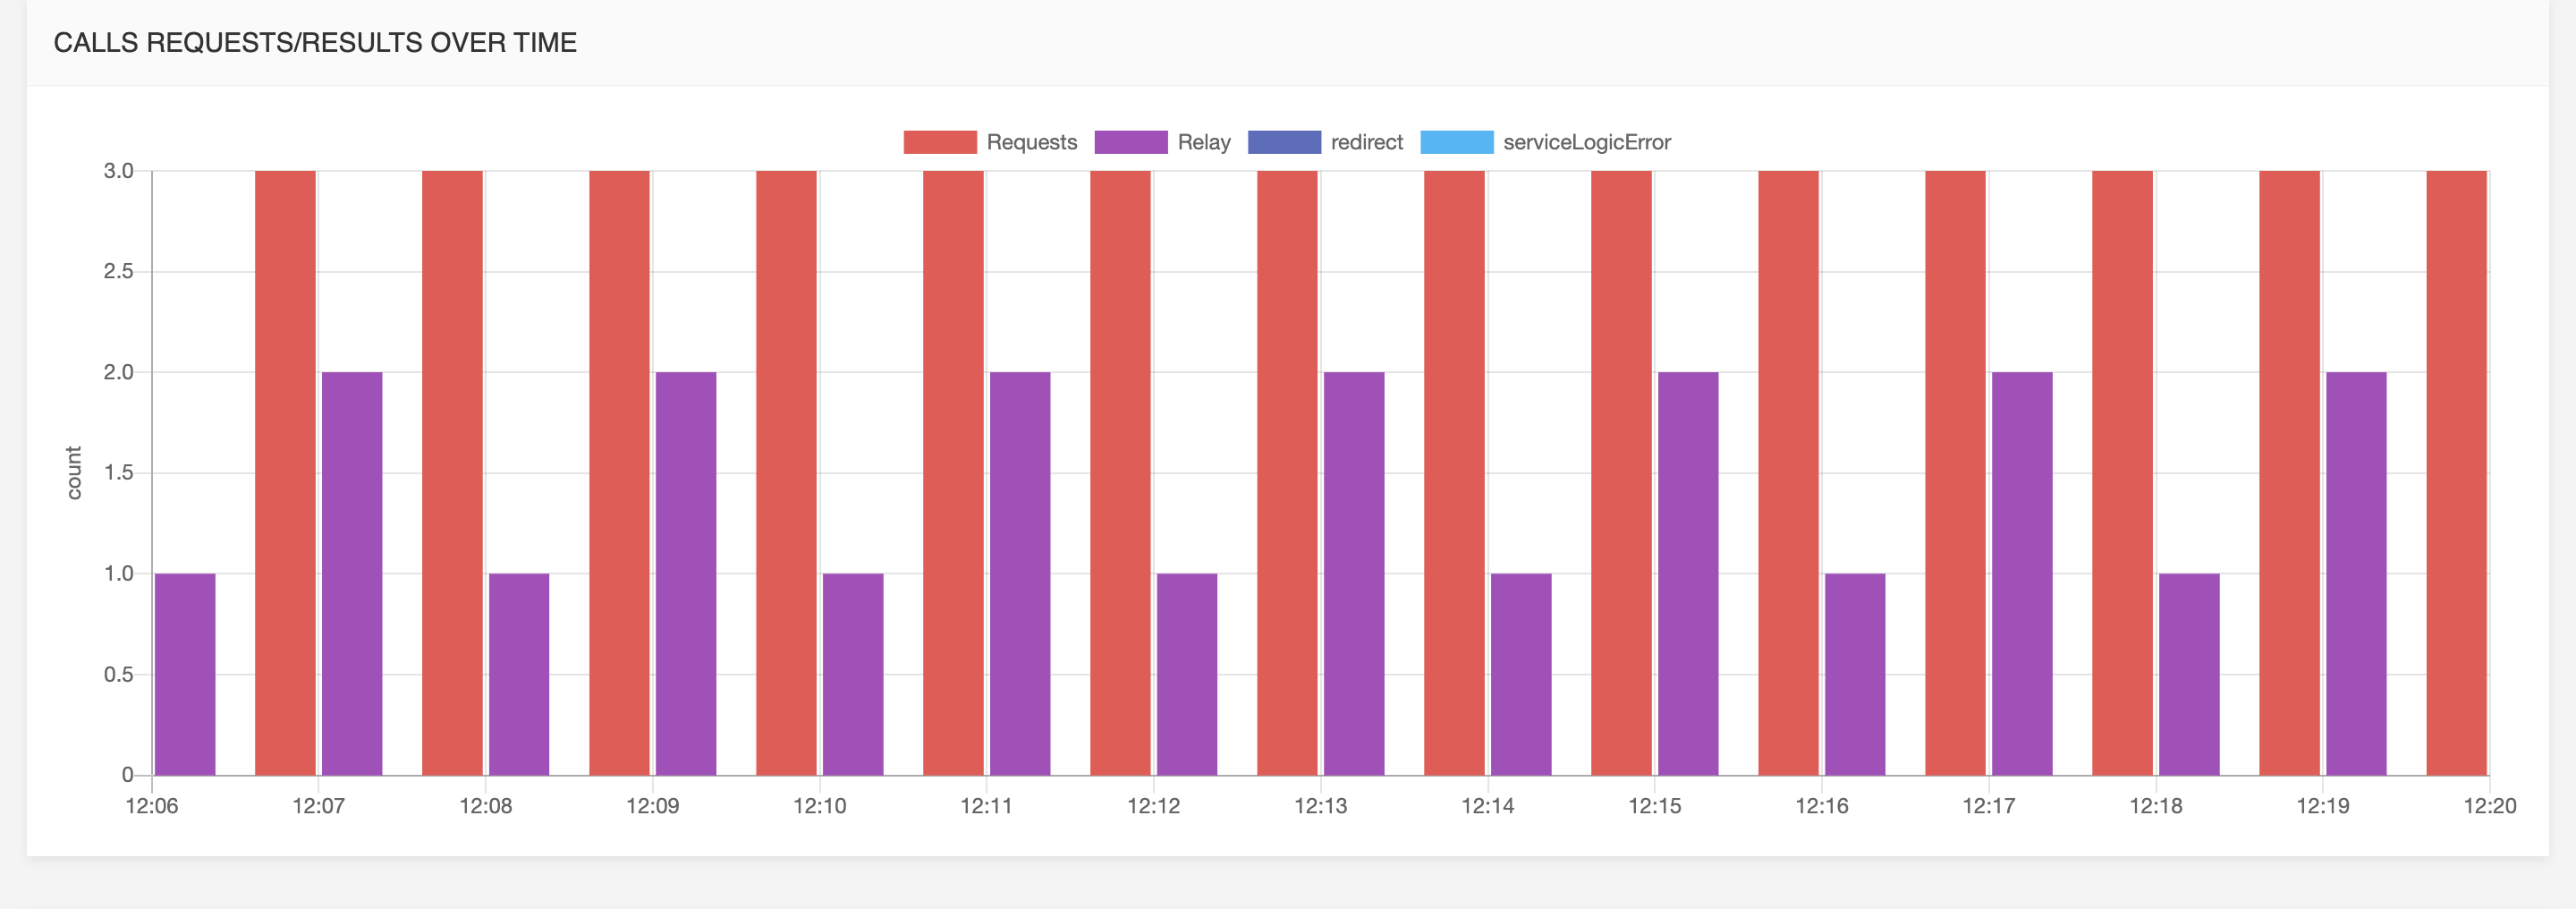
| Service Overview | Charts of requests, responses, call rate, processing time and open calls over time, per Call Processor or for the whole platform |
| System Overview | Status of the Element Managers and Call Processors and of their processes |
| Databases | Status of the internal databases and their replication |
| Cluster | Status of the Call Processor cluster resources, when clustering is used |
| Broker | Status of the internal message broker |
| SIP Agents | Status of the SIP peers monitored by probing (see SIP Agent Monitoring) |
| Media Servers | Status of the media servers controlled by SRE |
| SIP Registration | Status of the endpoints SRE registers on behalf of others |
| Stats: Counters | Rates of every counter per Call Processor |
| Stats: Performance | Execution time of requests and service logic nodes |
| Stats: SIP | Raw statistics of the SIP stack |
The Service Overview tab is customisable. Users can add tabs, rows and panels, and define each chart by choosing the metrics (counters or samples), the interface (SIP, ENUM, HTTP or generic), the aggregation (sum or rate), the servers to include and tags to filter or group by. Charts can be drawn as graphs over time, histograms or pie charts. The time frame is either relative (from the last 15 minutes up to the last 28 days) or an absolute date range.
Statistics
Built-in Counters and Samples
SRE collects two kinds of statistics:
- Counters count events: requests received per method, responses by outcome (relay, redirect, SIP response, loop, service logic error, and so on), executions of each service logic node, and provisioning requests made through the GUI. Every counter is tagged with the interface it comes from.
- Samples measure durations: the processing time of each request and, when detailed node statistics are enabled, the execution time of each node of each service logic. This profiling shows which node of a service logic takes the most time, for example a slow external query.
Detailed per-node statistics are disabled by default, since they add load on the Call Processors. They can be enabled in the system settings when needed.
The Stats: Counters and Stats: Performance tabs show the mean values over the last 15 minutes, the last 5 minutes, the last minute and the last 10 seconds. History is kept in the statistics database for a configurable number of days, and is used by the Service Overview charts. Counters are also written every minute to a CSV file on the Element Managers, which external tools can collect.
System Metrics with Telegraf
Since SRE 4.0, a Telegraf agent can send operating system and subsystem metrics to the same statistics database. Built-in charts then show disk activity, CPU usage, processes, network traffic (bytes, packets, TCP segments and UDP datagrams), PostgreSQL cache and connections, record activity, and MongoDB commands and connections, next to the service statistics.
Custom Counters from the Service Logic
Service designers can add business-level metrics directly in the service logic:
- Increment custom counters increments one or more named counters. The name and the increment can be fixed or taken from variables, so a single node can count, for example, calls per customer or per destination. Custom counters appear in their own category on the dashboard and can be used in Service Overview charts like built-in counters.
- Add tag attaches tags (name and value) to the current execution. The counters sent afterwards carry these tags, which allows charts to filter or group them, for example by customer or by trunk.
Alarms
System Alarms
SRE monitors a set of conditions continuously and raises alarms when thresholds are reached. They cover, among others:
- CPU, memory and disk usage, open files and database connections
- processing time of INVITE, REGISTER, OPTIONS and ENUM requests
- stopped processes, unreachable databases, database replication lag and database switchover
- MongoDB and cluster status, SIP stack memory and receive queue
- SIP agents that do not answer or reject probes
- missing CDRs or an unreachable CDR collector
- licence limits, certificates close to expiry and sudden changes in the number of records of a table
- service logic errors
The thresholds are set per category in the system settings, most with separate minor, major and critical levels. The SRE Alarms Guide lists all alarms, their severities and their SNMP traps.
Alarms have one of five severities: info, warning, minor, major or critical. Most alarms are cleared automatically when the condition disappears. A few, such as licence limits or expired certificates, must be cleared by an operator. Repeated occurrences of the same alarm are grouped within a configurable recurrence window and counted, rather than creating new alarms.
Since SRE 4.1, a verification duration (hysteresis) defines how long a condition must persist before the alarm is raised and notified. This avoids alarms that flap when a value fluctuates around a threshold. The duration can be set globally and overridden per alarm type. Clearing remains immediate.
Viewing and Managing Alarms
The GUI banner shows the number of active alarms for each severity. Clicking on one opens the Alarms page, filtered on that severity. The Alarms page lists all alarms with filters on severity, status, source node, type, date range, acknowledgement and clearance. Operators can acknowledge an alarm, to show it is being handled, or clear it manually. Both actions are recorded with the user and the time. Alarms are purged automatically after a configurable retention period.
Notifications
Alarms are forwarded to external systems in two ways:
- SNMP traps, sent to the configured trap receivers using SNMP v1/v2c or SNMP v3 with authentication and encryption. The MIB is described in the SRE Alarms Guide.
- E-mails, sent through the configured SMTP server to recipients for alarms at or above a chosen severity.
Alarms from the Service Logic
The service logic can raise its own alarms, to report conditions that only the service knows about:
- Generate alarm raises an alarm with a type, a description and a severity. The type and description can contain variables. To avoid alarm storms under traffic, a node sends the same alarm type at most once per minute.
- Clear alarm clears every active custom alarm whose type starts with the given prefix.
Custom alarms are shown on the Alarms page and sent as SNMP traps like system alarms.
Other notification nodes let the service logic inform external systems directly: Send Email sends an e-mail through an SMTP server, and Send syslog message sends a message with a chosen facility and level to a syslog server.
SIP Agent Monitoring
SRE probes the SIP peers listed under SIP Agents Monitoring by sending them SIP OPTIONS requests at a configurable interval (60 seconds by default). Probing over TLS is supported since SRE 4.1, and over SIPS since SRE 4.2. Each agent is reported as:
- UP: the agent answers positively
- DOWN: the agent answers with an error
- TRYING: no answer has been received yet
The status is shown on the SIP Agents dashboard tab, and an alarm is raised when an agent is down or does not answer. The SIP agent status node uses the same status in the service logic, with one exit per status, so that calls are routed only to peers that are up. When a peer needs a specific OPTIONS request, custom probing can be built as a service logic.
Logging
Log Files and Levels
SRE writes its logs per channel: call processing, service logic execution, alarms, accounting, GUI activity, REST API, probing, and so on. The level of each channel is set in the GUI, so that one area can be investigated in detail without raising the volume of the others. When an error is logged, SRE also writes the few most recent entries of the same channel that were below the configured level, which gives context to the error without permanent debug logging.
Since SRE 4.1, logs can be written in a structured format, logfmt or JSON, which tools such as Elasticsearch, Splunk or Graylog can index directly. Logs can also be sent to one or more syslog servers.
Summary Log
For every request, on the SIP, ENUM and HTTP interfaces, SRE writes one summary line with:
- the input: calling and called number, HTTP method and URL, or ENUM number
- the logic: the path through the service logic, including switches between service logics
- the output: the result returned (relay, response code, HTTP response, ENUM answers)
- the duration of the processing
This line is enough to understand what happened to a call, and the duration helps identify slow executions.
Node Logging
Since SRE 4.1, every node has a Log message field. The message, which can contain variables, is evaluated after the node is executed and added to the summary line of the request. Service designers can thus record the key decisions of a call, such as the customer identified or the route chosen, without enabling tracing.
Log Viewer
Since SRE 4.1, the Logs page under the System menu displays the log files without shell access. Users select a file, highlight or filter lines containing a text, choose how many lines to show, and follow new lines live. Files can also be downloaded.
Call Tracing
Tracing records the full execution of selected calls: every node executed, with the value of every variable at each step. It is activated per interface on criteria that select the calls to trace:
| Interface | Criteria |
|---|---|
| SIP and SIP replies | Calling and called number prefixes |
| ENUM | Number prefix |
| HTTP | URL regular expression |
| Media processing | Calling number prefix |
| WebSocket processing | Connection identifier |
| CDR post-processing | From and To usernames |
| Scheduled service logic | Start and end date and time |
| Custom agents probing and custom registrations | One trace every N iterations |
Only matching calls are traced, so tracing can be used on a live platform without affecting other traffic. Since SRE 4.0, traces are stored locally on both Element Managers, which increases retention and keeps them across restarts. The number of traces kept is configurable, and the oldest are replaced first.
Traces are shown in the Traces tab of the service logic that handled the call. A trace can be replayed in the Service Logic Editor, with the same simulation timeline as a test call. Since SRE 4.1, a trace can also be loaded as simulation data: the real call becomes a test case, which helps reproduce an issue and check its fix before release.
Events Log and Audit Trail
Since SRE 4.0, an events log records every state change on the platform: alarms raised and cleared, process starts and stops, database role changes, and so on. Every midnight, the current state of each item is also written, so the log alone gives the state of the platform at any time.
User actions are recorded in audit logs: GUI operations and data changes, and REST API requests. Together with the creation and modification information kept for each data record, they show who changed what and when.
Support and Health Checks
Since SRE 4.1, a support info file can be generated from the Help menu. It gathers logs and system information in one archive, ready to attach to a support ticket.
For checks performed after an upgrade or during maintenance, refer to the technical note "Health Check Guide". For measuring the performance of individual nodes or complete service logics, refer to the technical note "Performance Analysis Tools". The SRE Operations and Monitoring Guide describes the monitoring of the underlying systems (file systems, databases, SIP stack and cluster) by external tools.
Example: Monitoring a Partner API
A service provider routes calls based on the answer of a partner's number portability API, queried over HTTP. If the API fails, calls are routed with a default rule, and the operations team must know about it.
The service logic is designed as follows:
- The partner serving the called number is read from the data model into the variable
partner, and an Add tag node sets the tagpartnerto its value. - An HTTP JSON request node queries the API.
- On success, a Clear alarm node clears alarms of type
partner-api, and the call is routed with the result. - On error response, timeout or failure, an Increment custom counters node increments
partner_api_failure, and a Generate alarm node raises a major alarm of typepartner-apiwith the description "Portability API unavailable for [partner]". Its Log message field records the HTTP status. The call is then routed with the default rule.
On the platform:
- The alarm appears in the GUI banner and on the Alarms page, and is sent as an SNMP trap and an e-mail to the operations team. Even if thousands of calls fail, the node sends it at most once per minute.
- On the dashboard, a Service Overview panel shows
partner_api_failuregrouped by thepartnertag next to the call rate, so the team sees when failures started, how many calls were affected and for which partner. - The summary log of each affected call shows the failure branch and the logged HTTP status.
- When the API recovers, the next successful query clears the alarm.
To investigate further, the team activates tracing for a test number, places a call and opens the trace in the Service Logic Editor to see the exact request and response.