All inquiries related to the features described in this document can be emailed to support@netaxis.be.
Service Logic Editor
Introduction
The Session Routing Engine (SRE) is a platform mainly based on SIP, built upon a Kamailio SIP Proxy server pluggable interface. It receives hundreds of call requests per second and provides routing responses.
When the SRE receives a call request, it applies a programmable service logic to route the call to the target destination or to reply to the originating equipment with redirect or rejection information. Once it has been translated, a response is sent to the requester containing the required information.
INFO
Selecting the service logic(s) that the SRE will use in production is explained in the last section of this document : Selecting service logics for operations. Defining proper setup by assigning the appropriate service logic to each interface communicating with the SRE is mandatory for efficient operations.
This document describes the Service Logic Editor, which allows creating and selecting service logics for the SRE to operate.
Service Logic List
From the main menu bar, select Service Logic to open the menu, then Service Logic Editor to open the Service Logic List page.
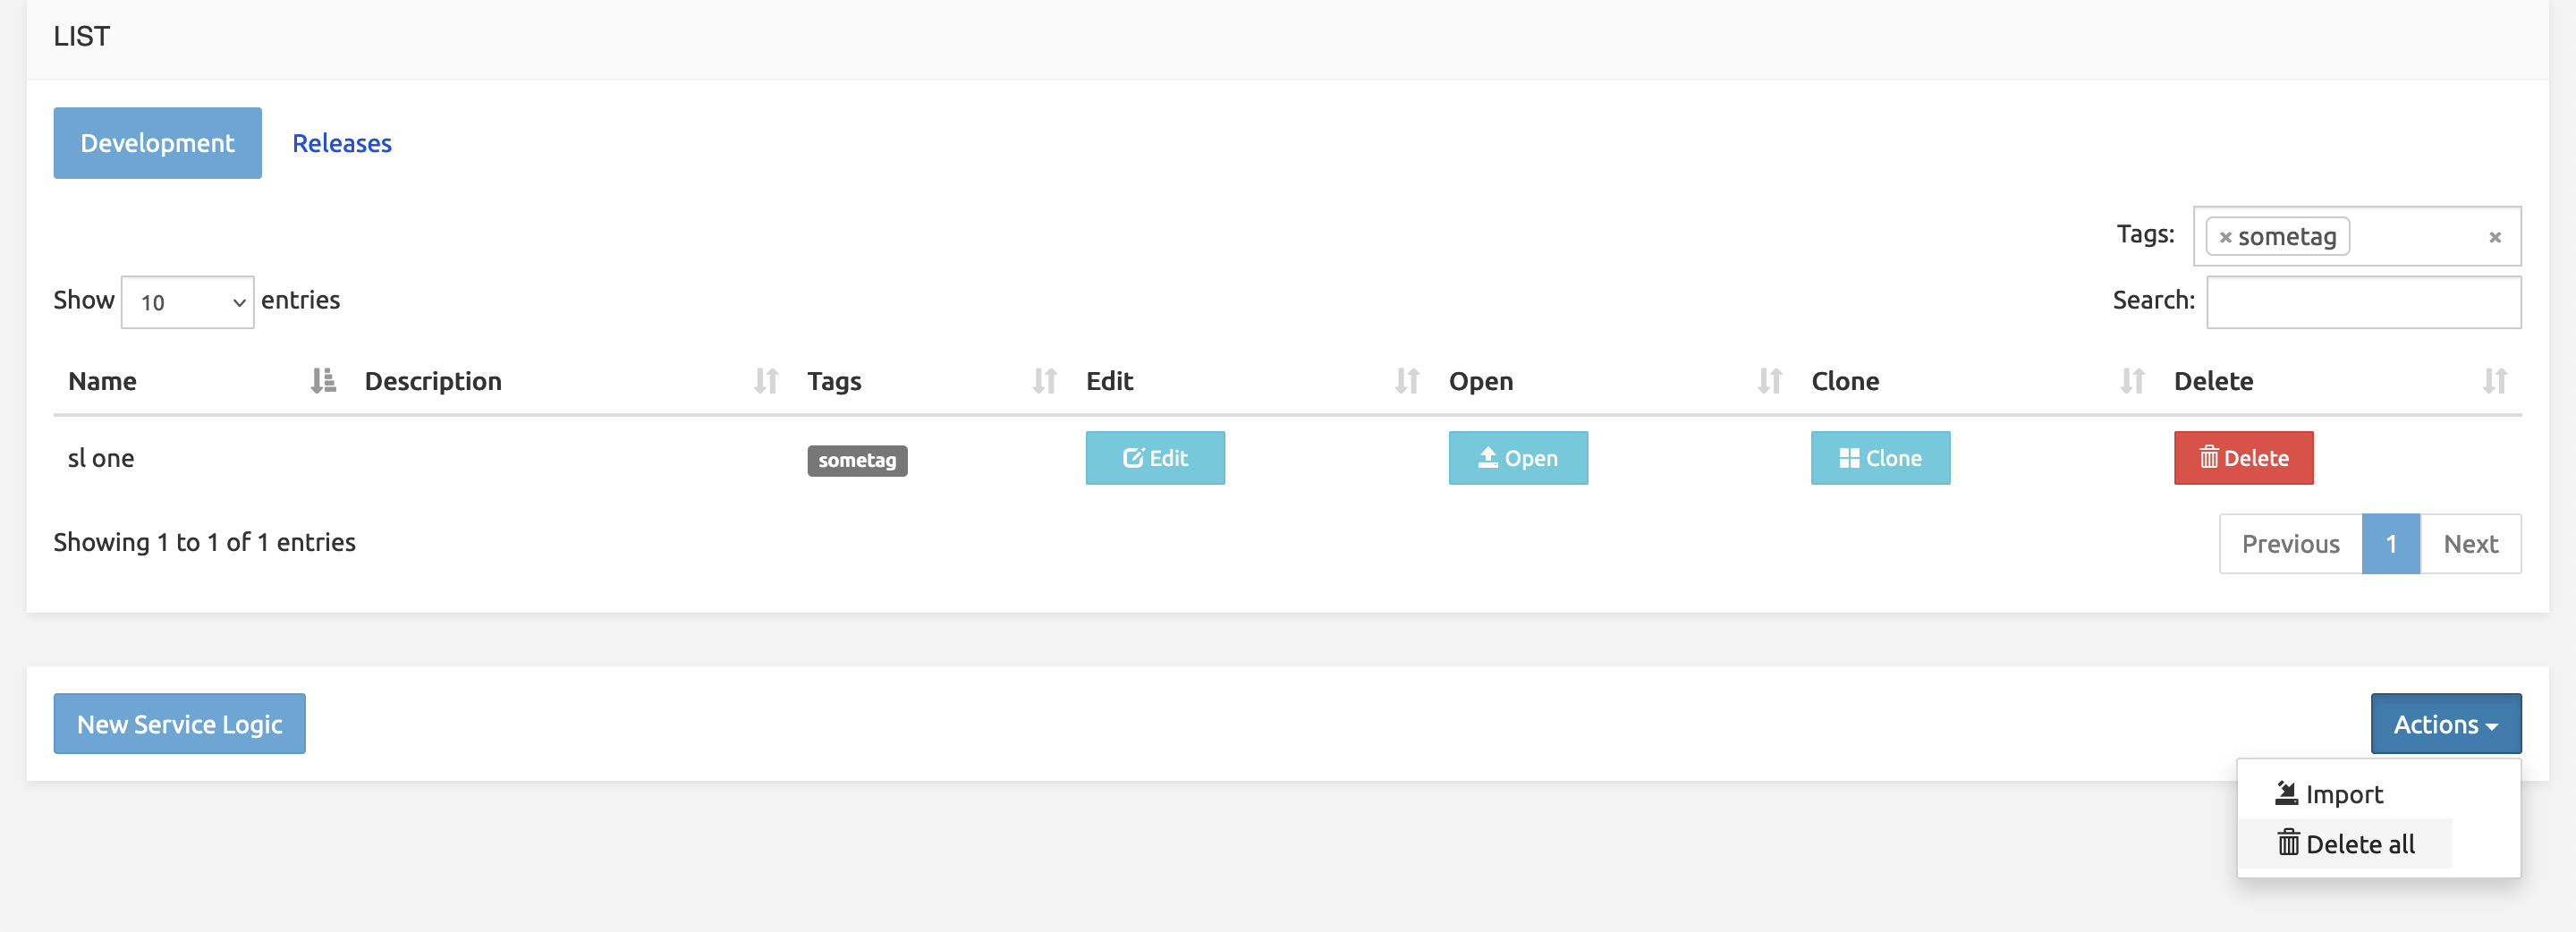
Development vs Releases
This page displays all the service logics present in the system. They are categorized along two modalities:
The Development tab displays the service logics that are being developed, i.e. which remain editable.
The Releases tab displays the service logics that have been released. They are frozen in new, non-editable, releases suitable for deployment.

The list can be filtered using the Tags and Search fields (top right) ; it can be limited to a set number of items (Show nn entries on top left). Previous / Next buttons at the bottom right allow navigating through the pages.
The New Service Logic button (bottom left) allows the creation of a service logic from scratch (see below).
The Import button (bottom right) allows importing a service logic file (.slid) exported from another SRE system.
For each listed service logic, the following actions are available:
- Edit button: opens the service logic for editing
- Open button: opens the service logic only for simulation (no edition possible)
- Clone button: duplicates the service logic by creating a copy with a new name and description.
- Delete button: deletes the service logic (with Y/N confirmation).
Opening and editing an existing Service Logic
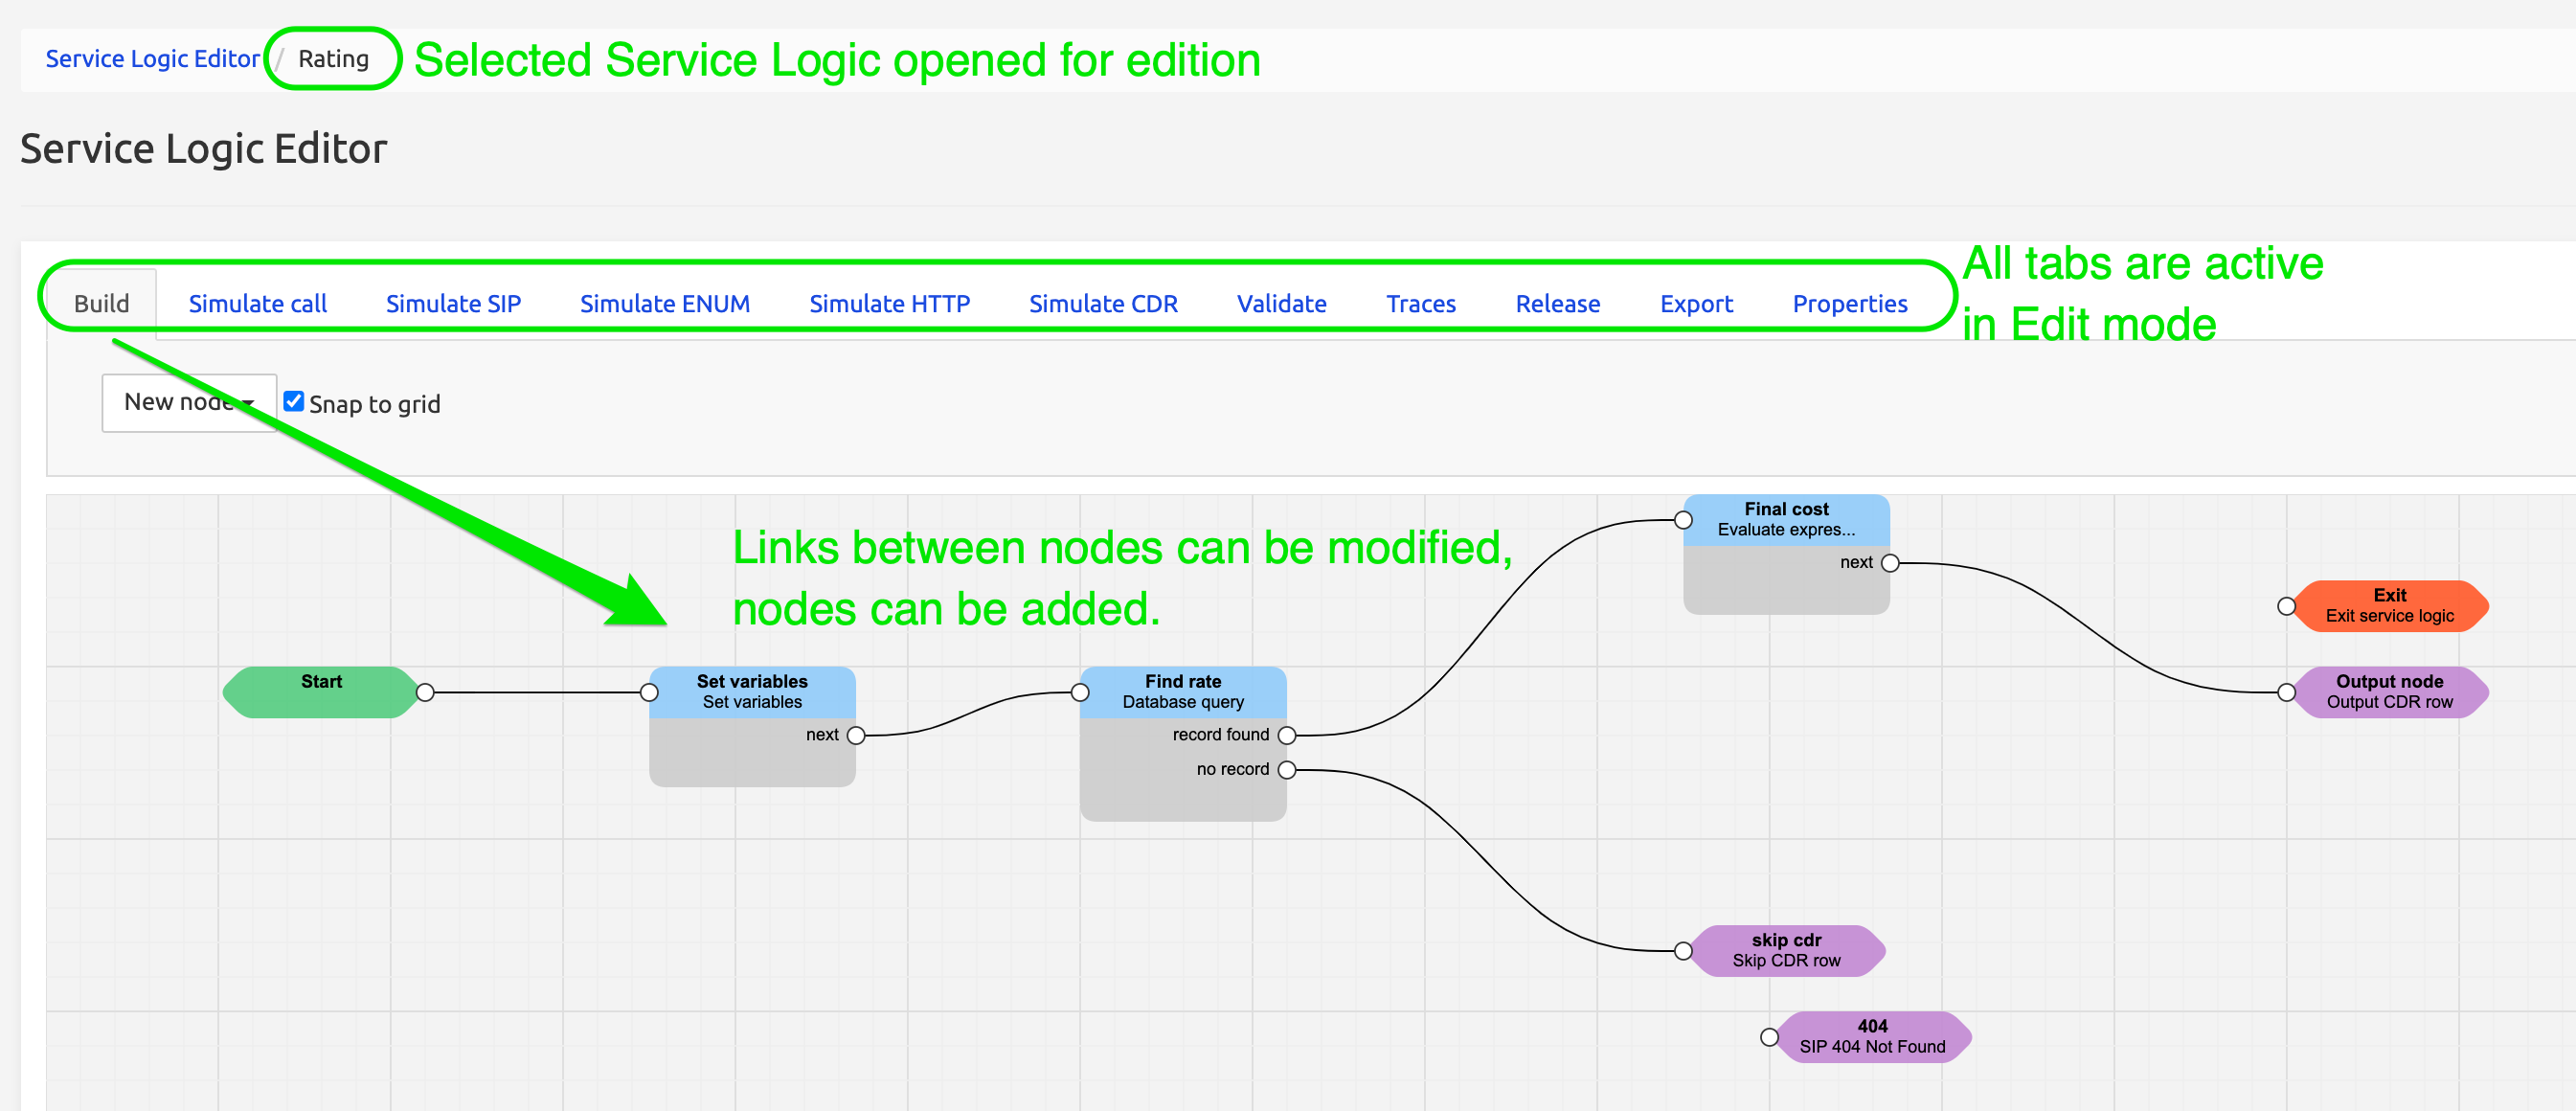
To open and edit an existing service logic, click the Edit button on the corresponding line.
This opens the Service Logic Editor page in Edit mode, showing the full set of function tabs:
- Build
- Simulate call
- Simulate SIP
- Simulate ENUM
- Simulate HTTP
- Simulate CDR
- Validate
- Release
- Traces
- Export
- Properties.
The selected service logic can be fully edited and managed (see Using the Service Logic Editor below).
Opening a SL in a development state that is, for whatever reason, also the active SL will show a warning:

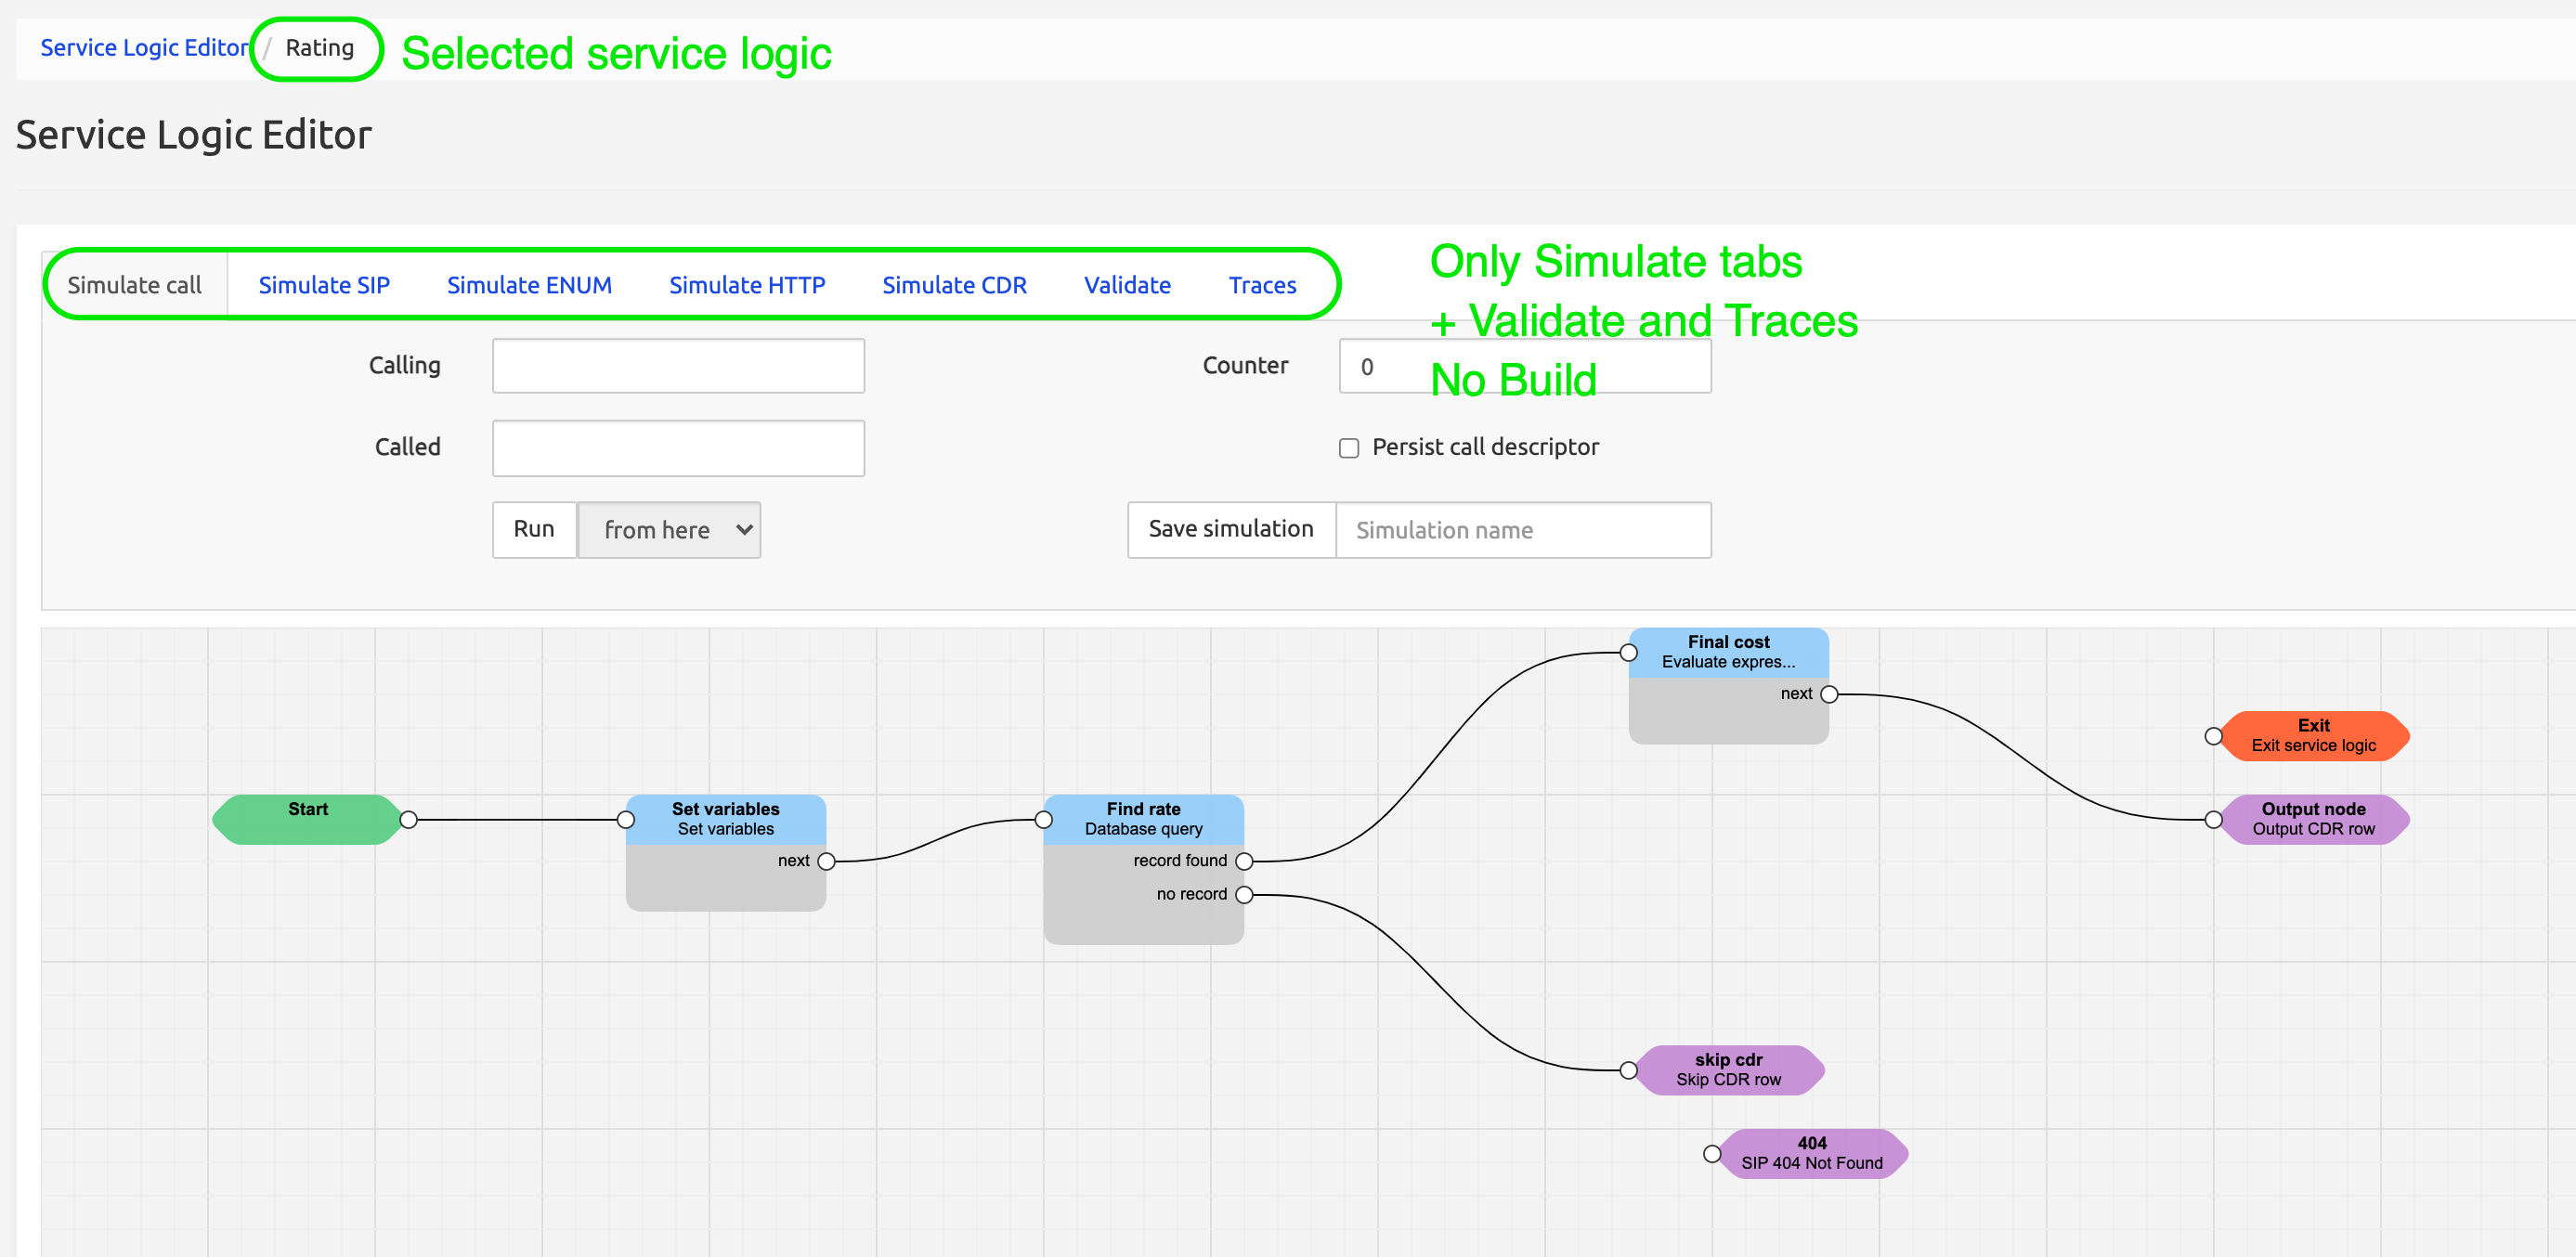
To open an existing service logic without editing features, click the Open button on the corresponding line.
This opens the Service Logic Editor page in Run-only mode, showing only the Simulate tabs and Validate and Traces tabs. The selected service logic cannot be edited: only simulations will be able to run (see description of Simulate call tab and other Simulate tabs below).
Creating a new Service Logic
To create a new service logic, click the New Service Logic button (bottom left in List page).
This opens the New Record page, where you provide the Name and Description of the new service logic.
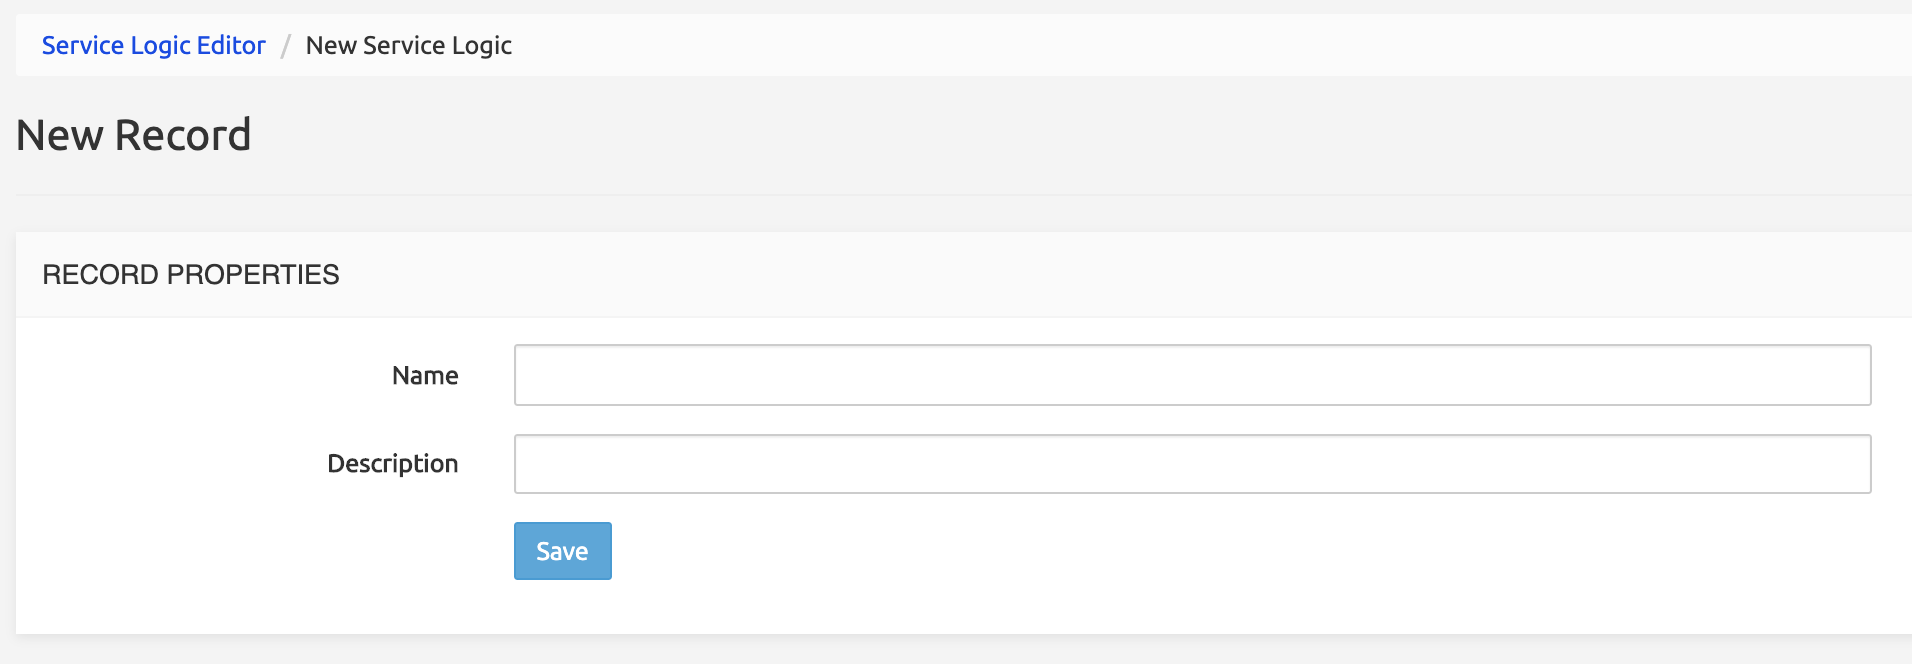
Click the Save button: this opens the Service Logic Editor page in Editor mode (showing the 7 tabs) to start designing the new service logic.
Importing a Service Logic
The Import button in the List page (see above) allows importing a service previously exported from a different SRE system.
A modal window Import opens where you can select the exported service logic file (.slid) stored on your system.
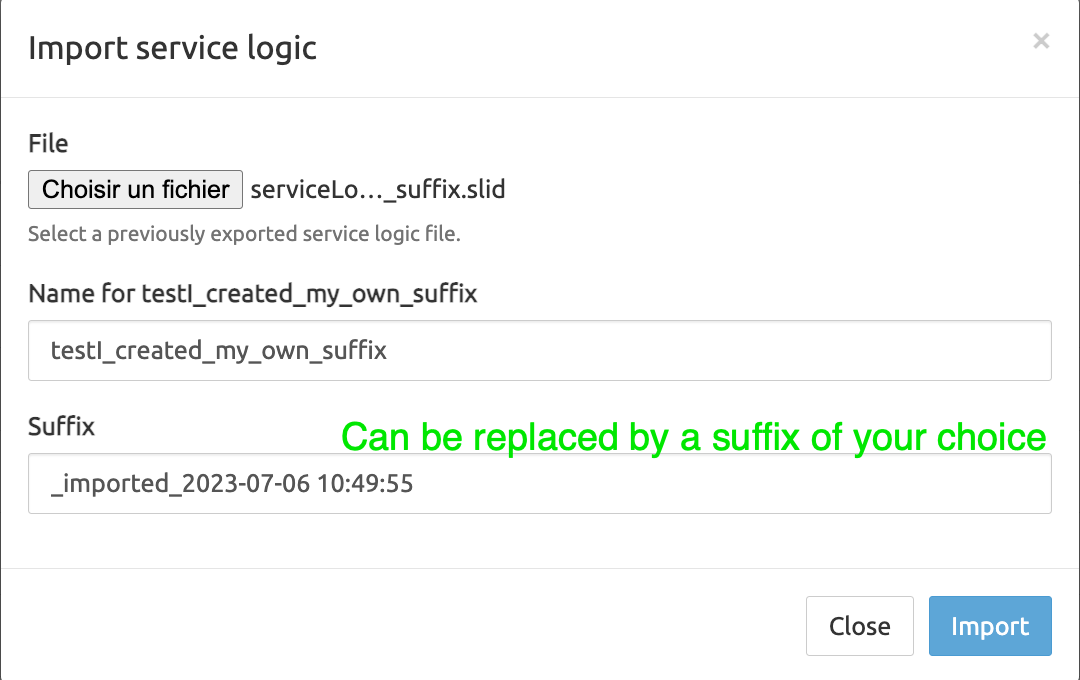
You can keep the default suffix (_imported_<date>) or replace it by a suffix of your choice.
Deleting all Service Logic
The Delete all button in the List page allows deleting all service logic that match the tags currently selected. A confirmation dialog is shown.
INFO
the system prevents to delete the service logics if one of them is in use directly or indirectly.
Using the Service Logic Editor
Service Logic Nodes Description
An SRE service logic is made of interconnected nodes which create a flow of different branches that each call will traverse. This section describes nodes characteristics. The specific function of each node is further described in the separate document Service Logic Nodes Description.
Node categories and function
Nodes are grouped along the following categories and have the following functions:
Processing nodes allow processing of the input data with a wide variety of operations.
Service sub-logic (macro) nodes allow embedding an existing service logic as a sub-logic of the parent one.
Output nodes allow selecting an appropriate SIP/ENUM/HTTP answer as output
Exit nodes are the paths used to exit the service logic after processing of the input data. The result is returned to the call originator.
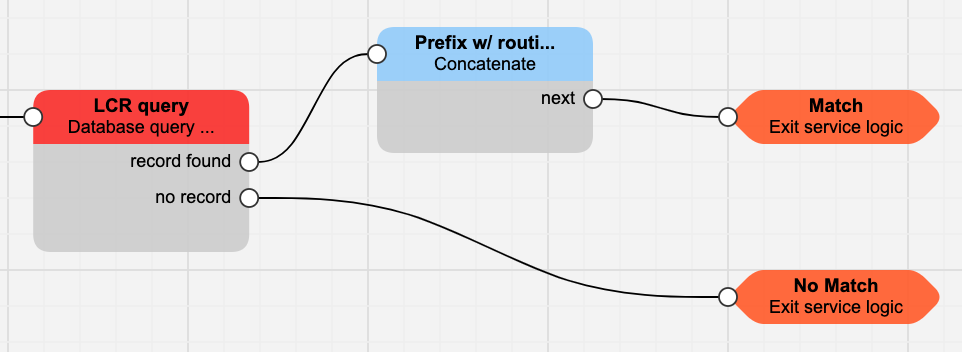
The picture below shows a simple example of two exit nodes in a Least Cost Routing service logic: Match / No Match.
Nodes graphical layout
The graphical representation of the nodes uses the following elements, which are common to the processing and sub-logic types.
The Processing and Service sub-logic nodes have a label and a body, with one left connector (on the label's left edge) and one or more right connectors (on the body's right edge).
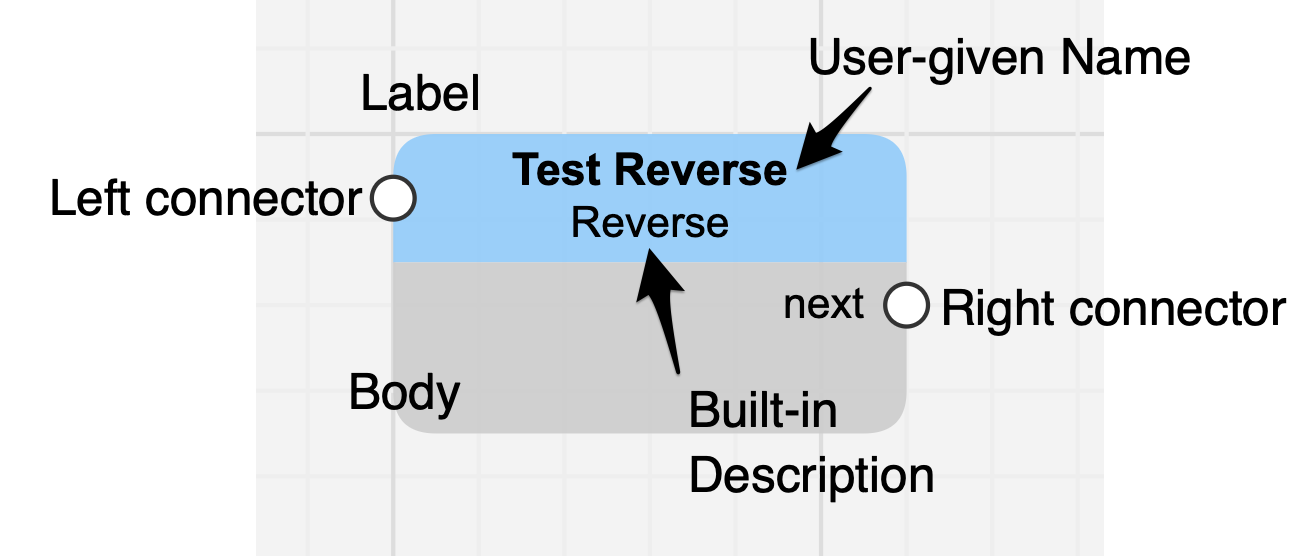
The label shows the user-given name. The second line in the label shows the built-in description of the node (which shows in the New Node page).
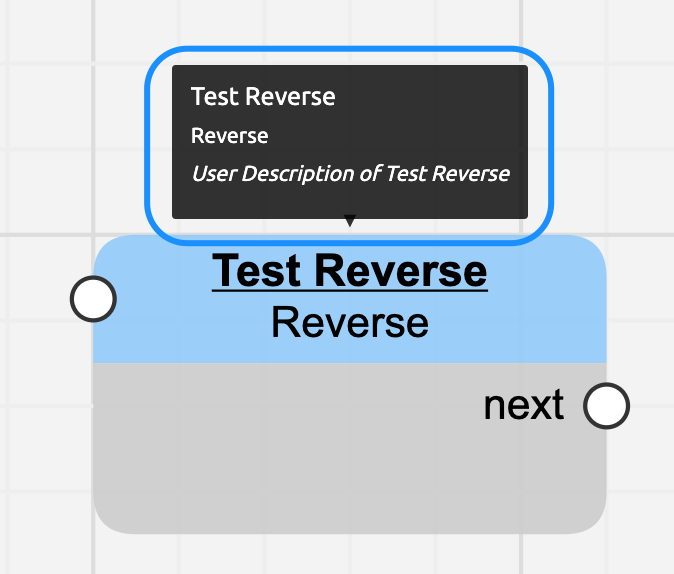
If a user description is provided, it will appear when mousing-over the label (third line, italics).
The Start node only has the Start label and a right connector. It must be the leftmost node in the service logic line.
The Output and Exit nodes have a label with the user-given name and the built-in description, and a left connector. They cannot be connected to a next node, only to one (or more) previous ones.
If a user description is provided, it will appear when mousing-over the label in the Build grid.
Clicking the name or description in the label of any existing node opens the Edit node screen, allowing to modify the user-given Name, Description and the elements defined.
Nodes color code
The graphical representation of the nodes on the grid uses the following colour code:
Node Color Example
Start Green 
Processing Blue label / Grey body 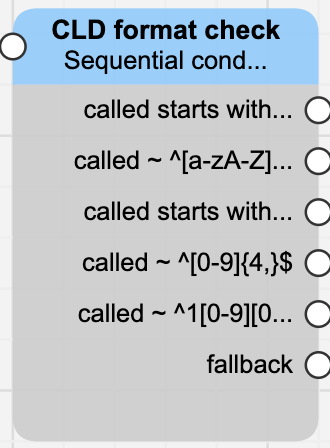
Service sub-logic Orange label / Grey 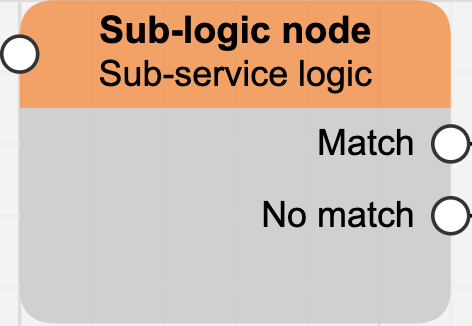 (macro) body
Output Purple 
Exit Dark Orange 
Deprecated nodes Red label / Grey body 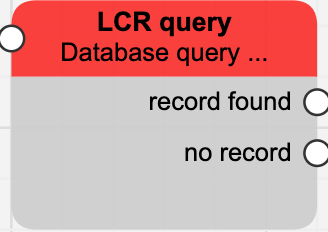
Deprecated nodes
Deprecated nodes are legacy nodes for which a better alternative is available in the current SRE release. Deprecated nodes in existing service logics keep being executed, but they cannot be used in service logics being created from scratch. They still are shown in the drop-down lists of nodes, but cannot be placed on the build grid.
The figure below shows 8 nodes of type Database; the 4 last ones, marked [deprecated], cannot be used in new service logic anymore.
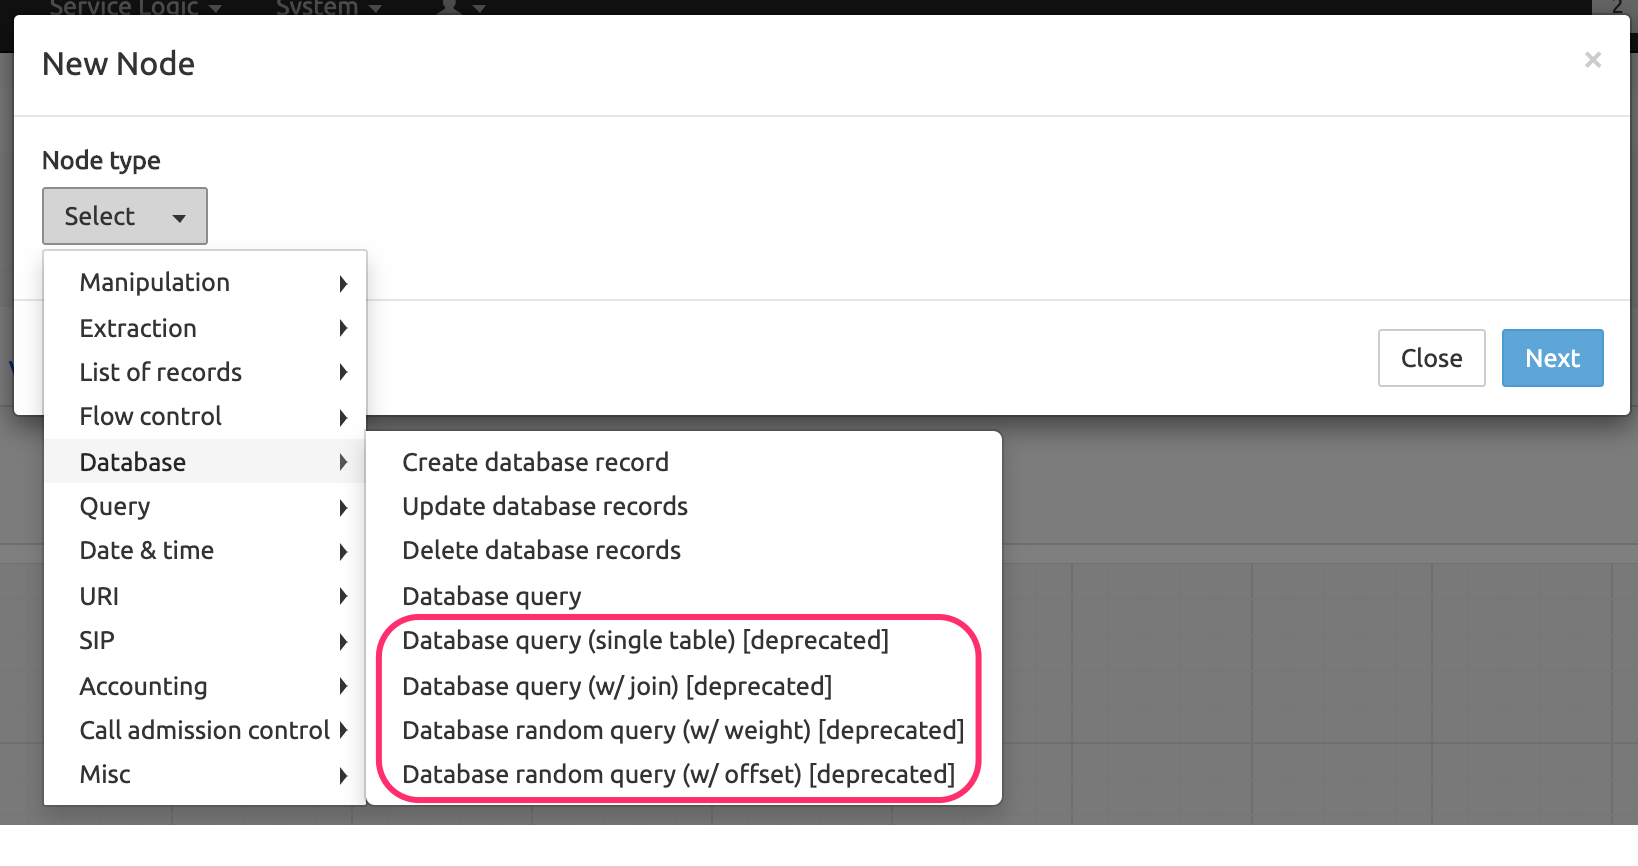
The table « Deprecated node | Better alternative node » in the document Service Logic Nodes Description lists all deprecated nodes and their new version or alternative.
Mouse operations in the Build and Simulate Call tabs
Selecting and moving nodes and moving the entire viewport is possible through the following mouse operations:
Wheel to scroll down or up vertically (or use the vertical elevator)
Hold Ctrl-shift-wheel to zoom in or out
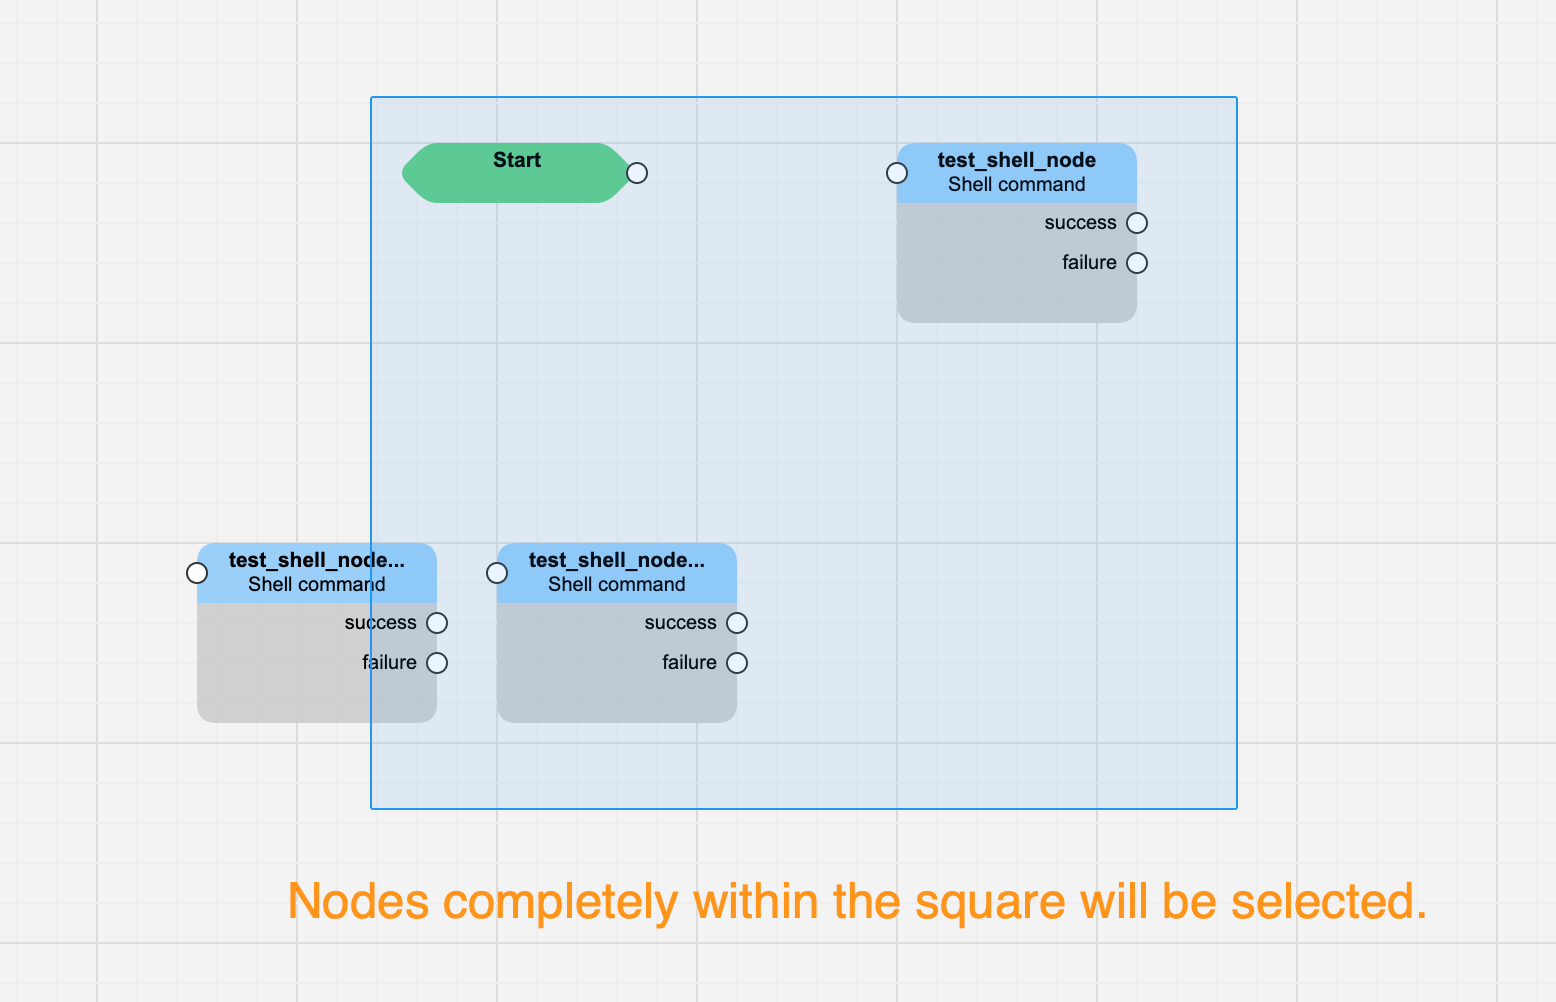
Left click to draw a square selecting all the nodes within the square. When selected, left-click the background to deselect all, Ctrl-left click to deselect one.
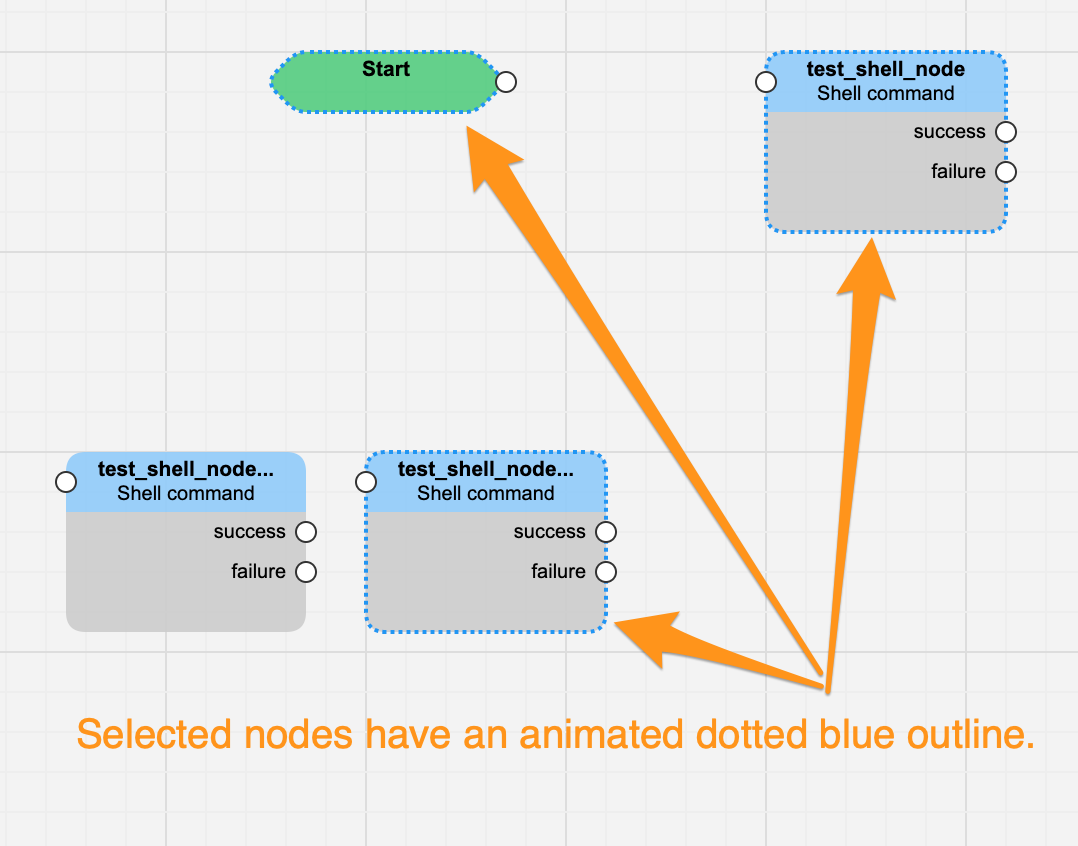
Ctrl-left click nodes successively to select several non-contiguous nodes. Ctrl-left click one to unselect it.
Hold Ctrl-left click anywhere and drag to move the whole viewport.
Build tab
The Build tab allows creating/editing the service logic by placing / adding nodes on a grid and connecting them.
Placing a node on the Build grid
To create a node and place it on the grid:
Decide what type and what particular node you need
Adjust the zoom on the grid using the mouse wheel
Click New node, then the node category, then the node type.
Click Next to continue with node creation
or
Click Stop to exit.
Fill in the Name and Description fields.
The name is mandatory. Leaving the Description empty prohibits the display of the node information in the grid when mouse-hovering the node label (see Nodes graphical layout above).
Add appropriate elements or fill in other fields.
For more details on each node, please refer to this node in the document Service Logic Nodes Description.
To stop the node creation, click Close (or the X cross top right)
or
To save the values entered and create the node, click Save.
When done, the new node is placed on the grid.
Connecting / disconnecting nodes
When placed on the grid after creation, nodes are not yet connected to any existing node.
As shown above, in the Nodes colour code table, nodes have one or more right connectors and (except for the Start node) only one left connector.
The logic of a service logic is linear, from left to right: connections are created from the right connector(s) of a lefthand node to the left connector of a righthand node.
To create a connection, click a connector at the right side of the lefthand node: it turns red and a dotted line appears. Then click the left connector of the righthand node: it turns red and the connection is created.
To remove a connection, quietly click the lefthand connector twice. Double-click works but zooms in at the same time.
Editing a node
To edit an existing node, click its label. This opens the Edit Node window, allowing to modify the elements defined at node creation. It also allows removing the node or duplicating it. This last operation spares time when similar nodes with complex design are needed.
Saving a Service Logic
There is no specific action for saving, and no Save button. The logic is automatically saved after every modification.
Simulate call tab
Once the nodes are created, placed and connected, the service logic can be tested. This is done using the Simulate call tab.
Click this tab to display its page, then fill in the Calling and Called fields and optionally the Counter, then click Run.
By default, the simulation runs in the service logic you are in. It is also possible to simulate starting from the parent service logic (up to the main one).
The service logic is executed, and each node executed shows a sequence execution number, black if ok, red if not. Dotted animated lines show the path followed based on the input received and the connections (unconnected nodes cannot be executed).
Persist Call Descriptor: when checked, in case of multiple iterations (for example call crankback), the call descriptor of iteration n-1 is kept at the start of iteration n, and only the last operation is performed. This avoids repeating the processing (DB queries, etc.) already performed during the previous iteration.
Two elements bring more information about how the simulation has run:
the Call Descriptors (one next to each executed node)
The Simulation Timeline (below the grid).
The Call Descriptors
The picture below shows the Simulate Call grid after a simulation has run. The black (or red) steps are Call Descriptors.
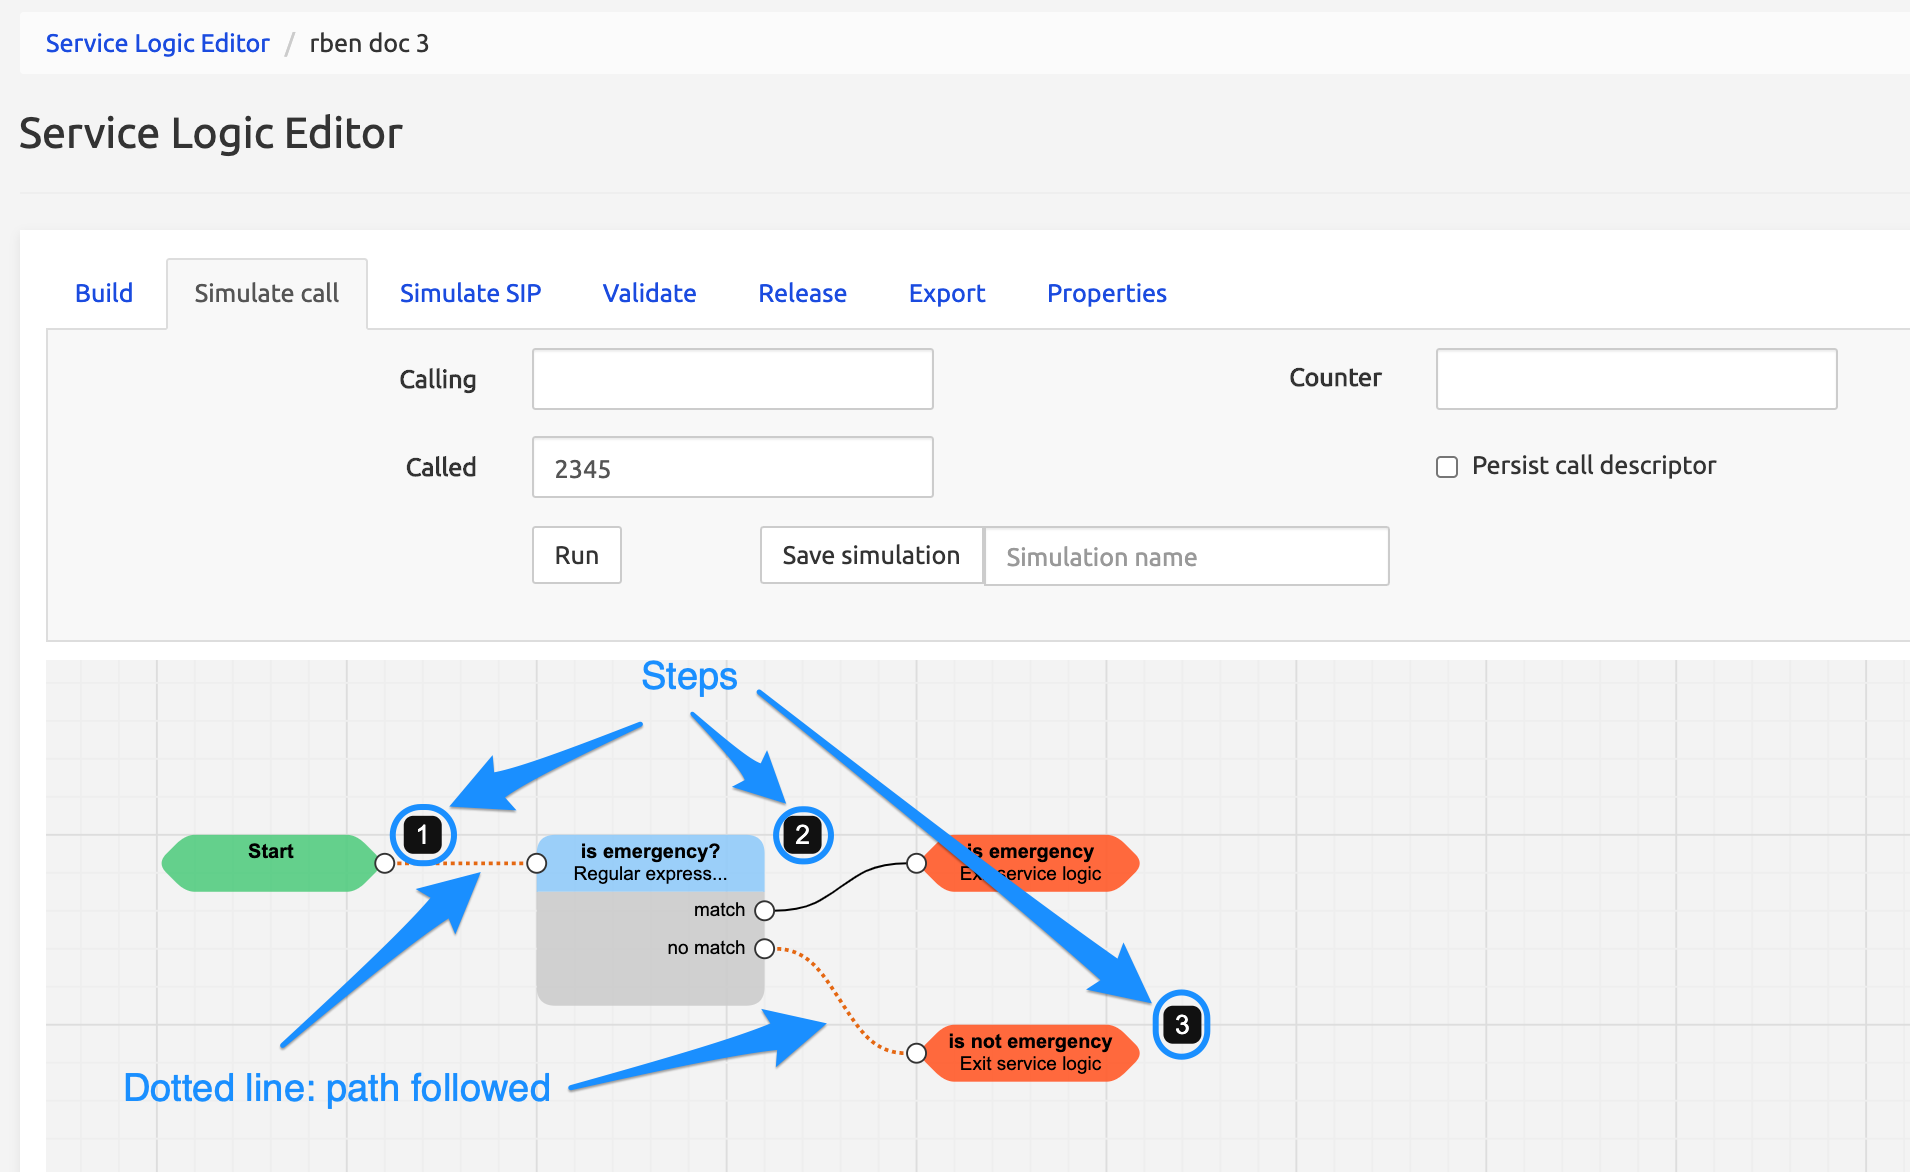
They are displayed when mousing over the numbered square and show the values before and after the considered step.
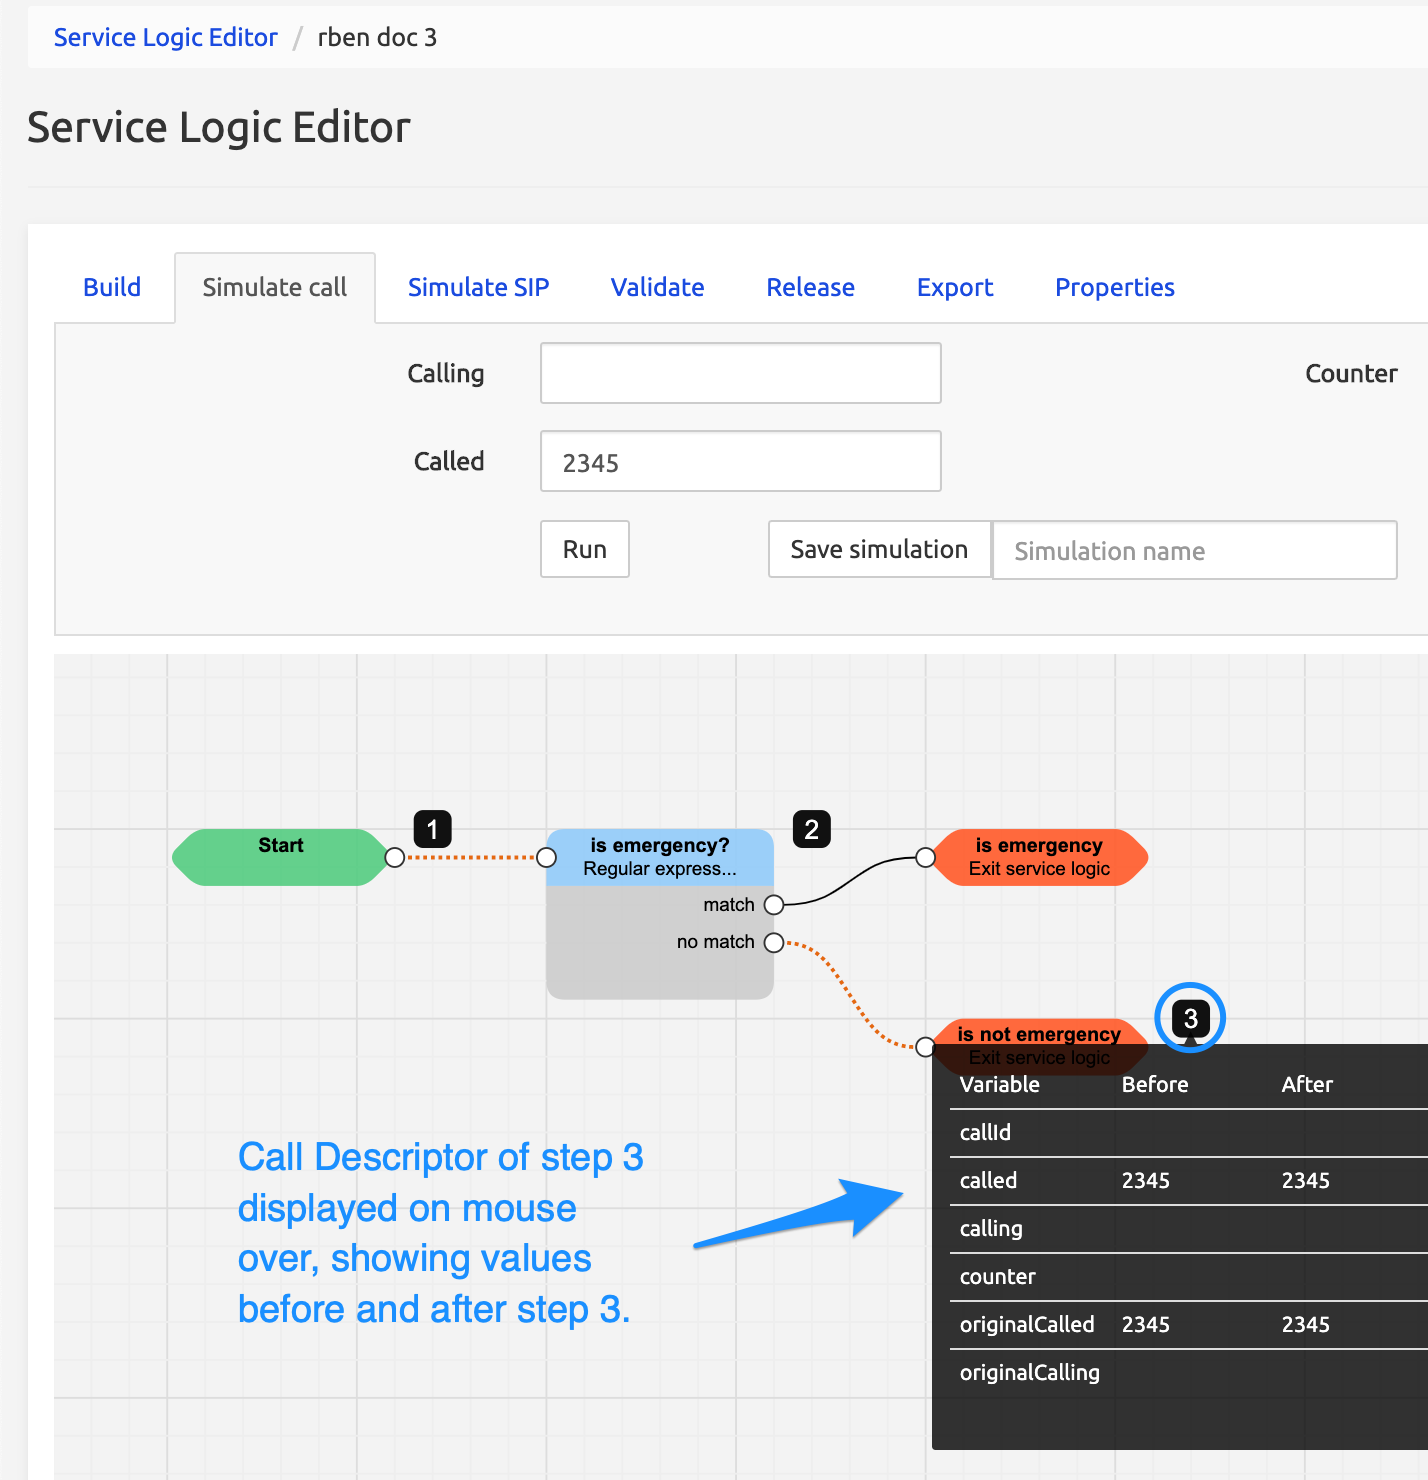
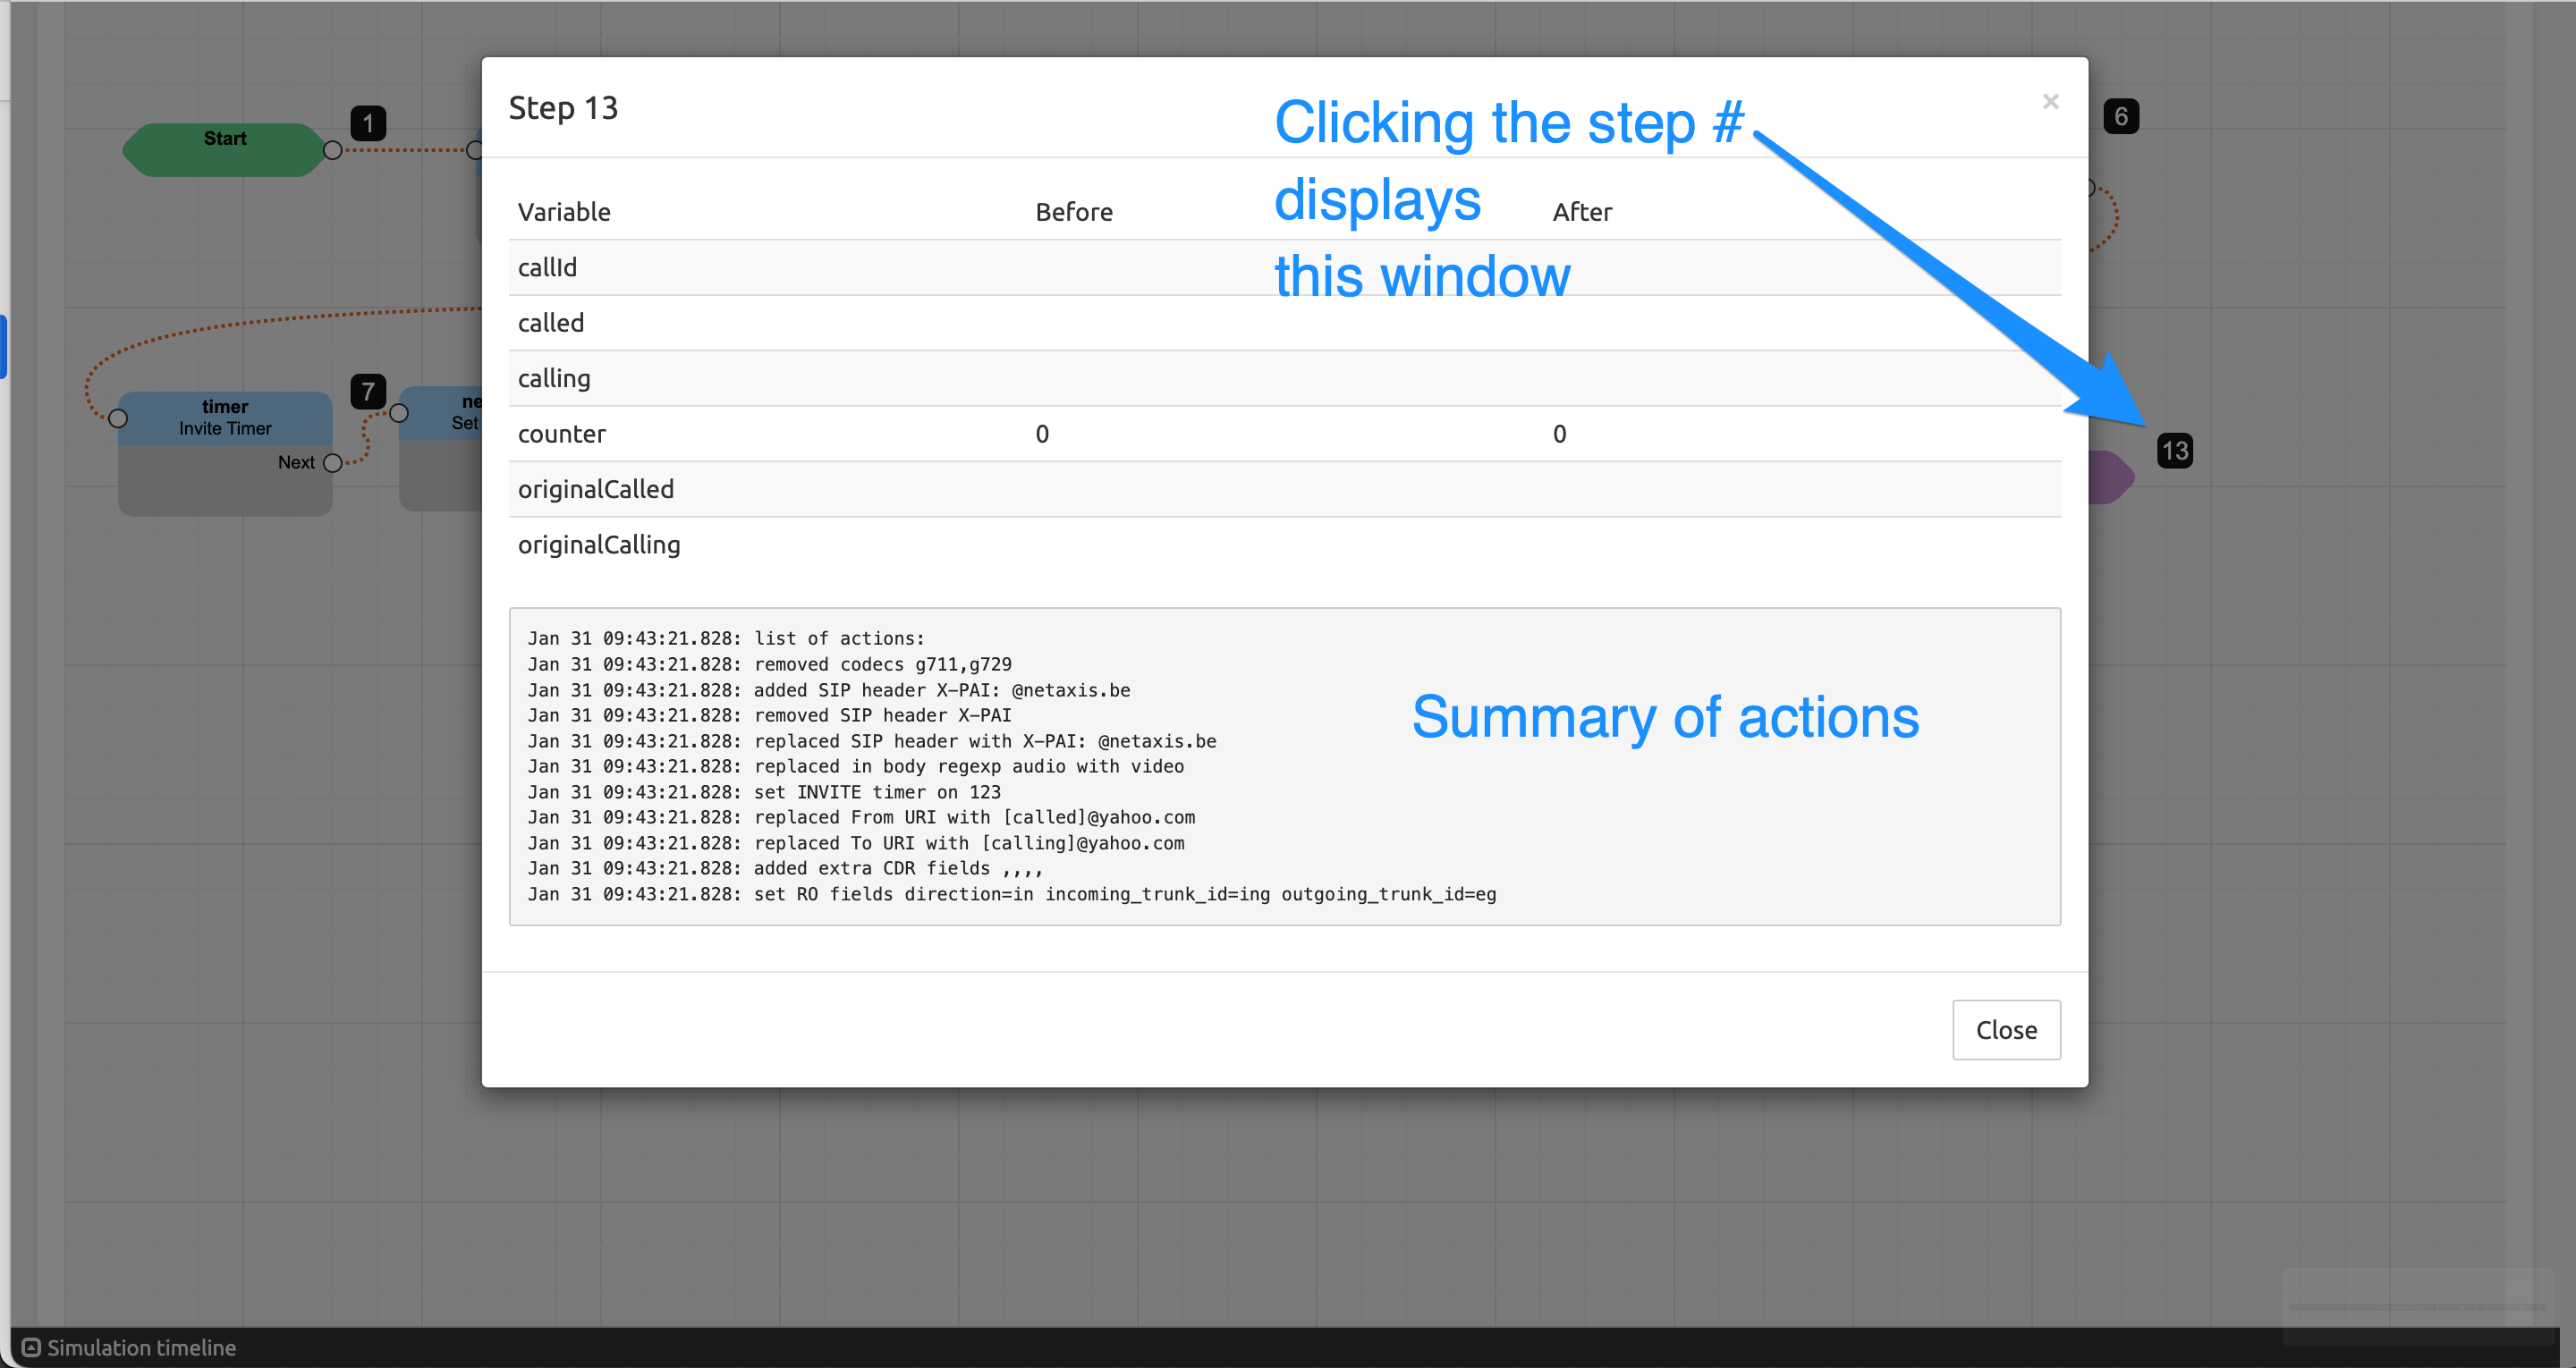
Clicking a step number in the viewport (instead of mousing over) opens a modal window for the clicked step, showing the data from the Call Descriptor.
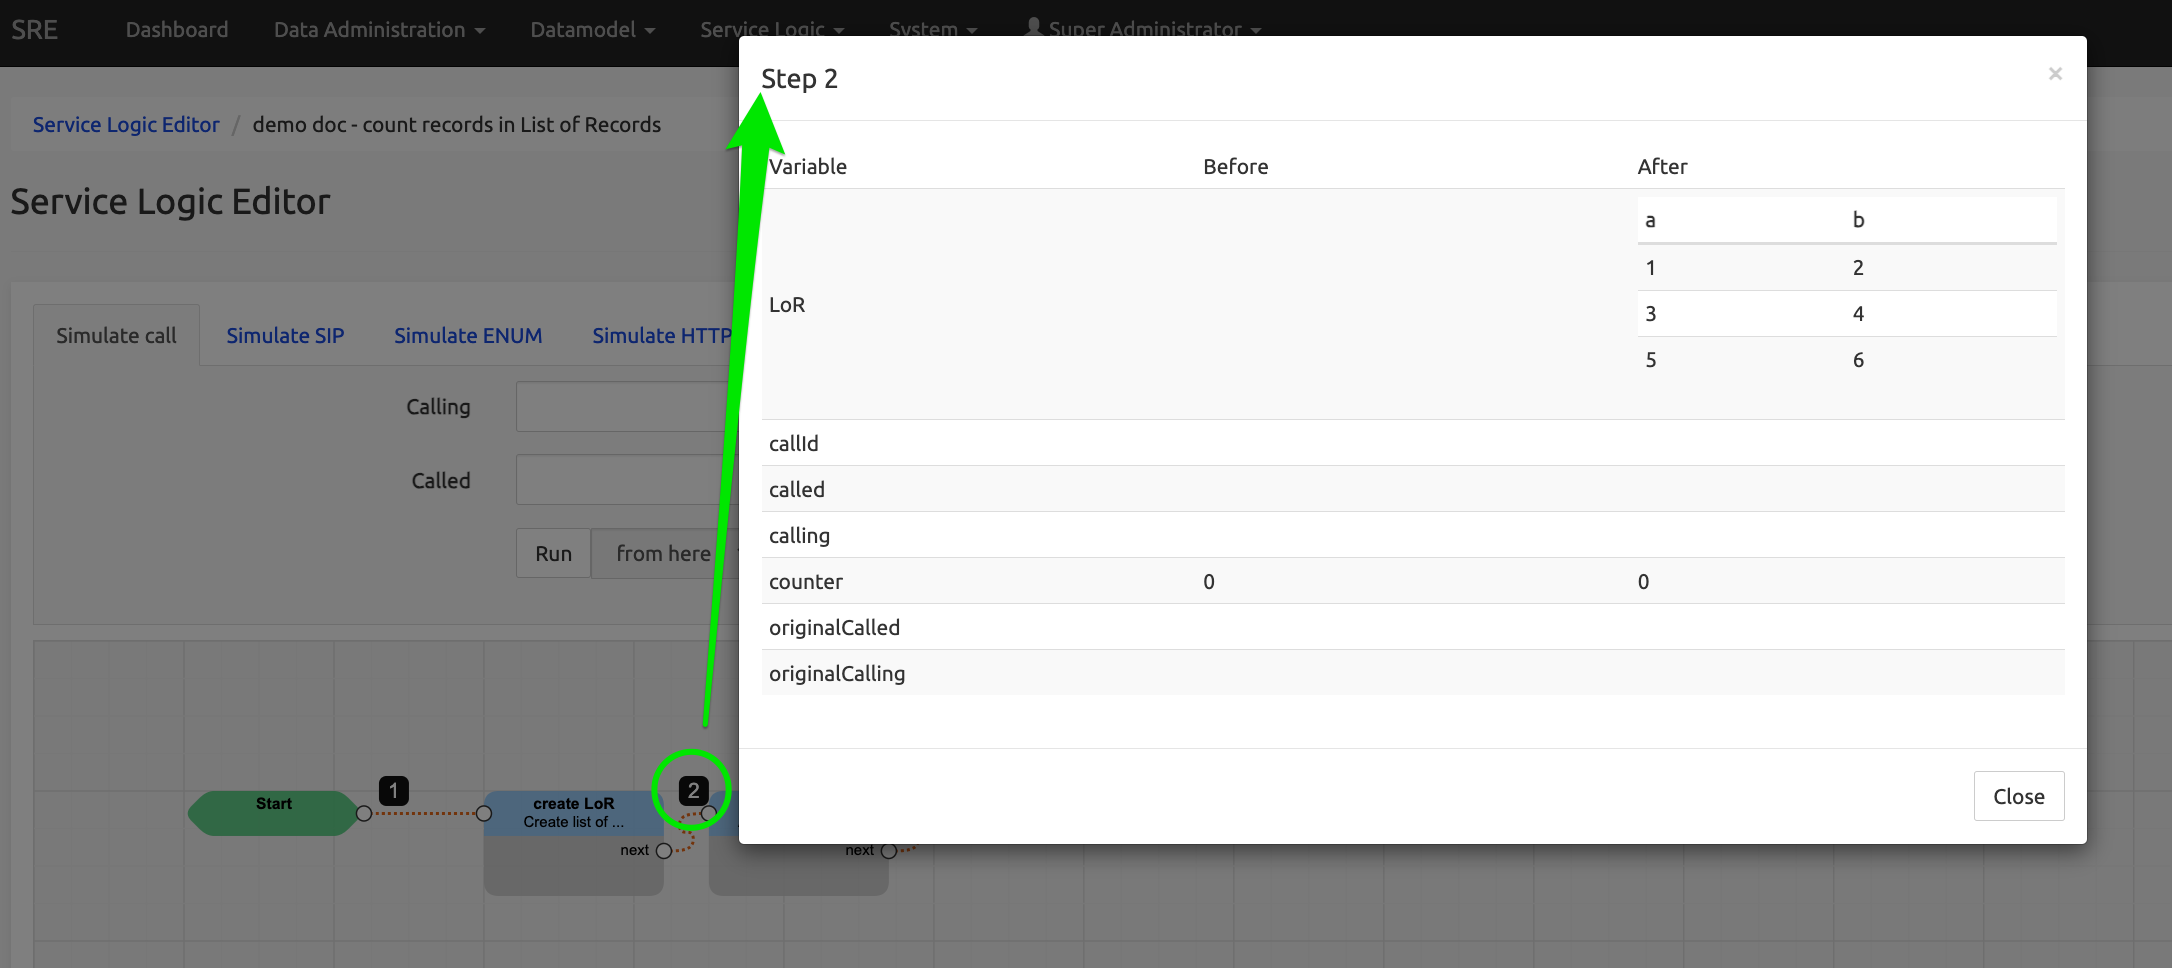
Queries are logged in Call Descriptors of External Query nodes
For more details see SRE Nodes Description document.
SIP manipulations are logged in Call Descriptors of SIP nodes
When a SIP node performs an action, it's logged in the node's Call Descriptor:
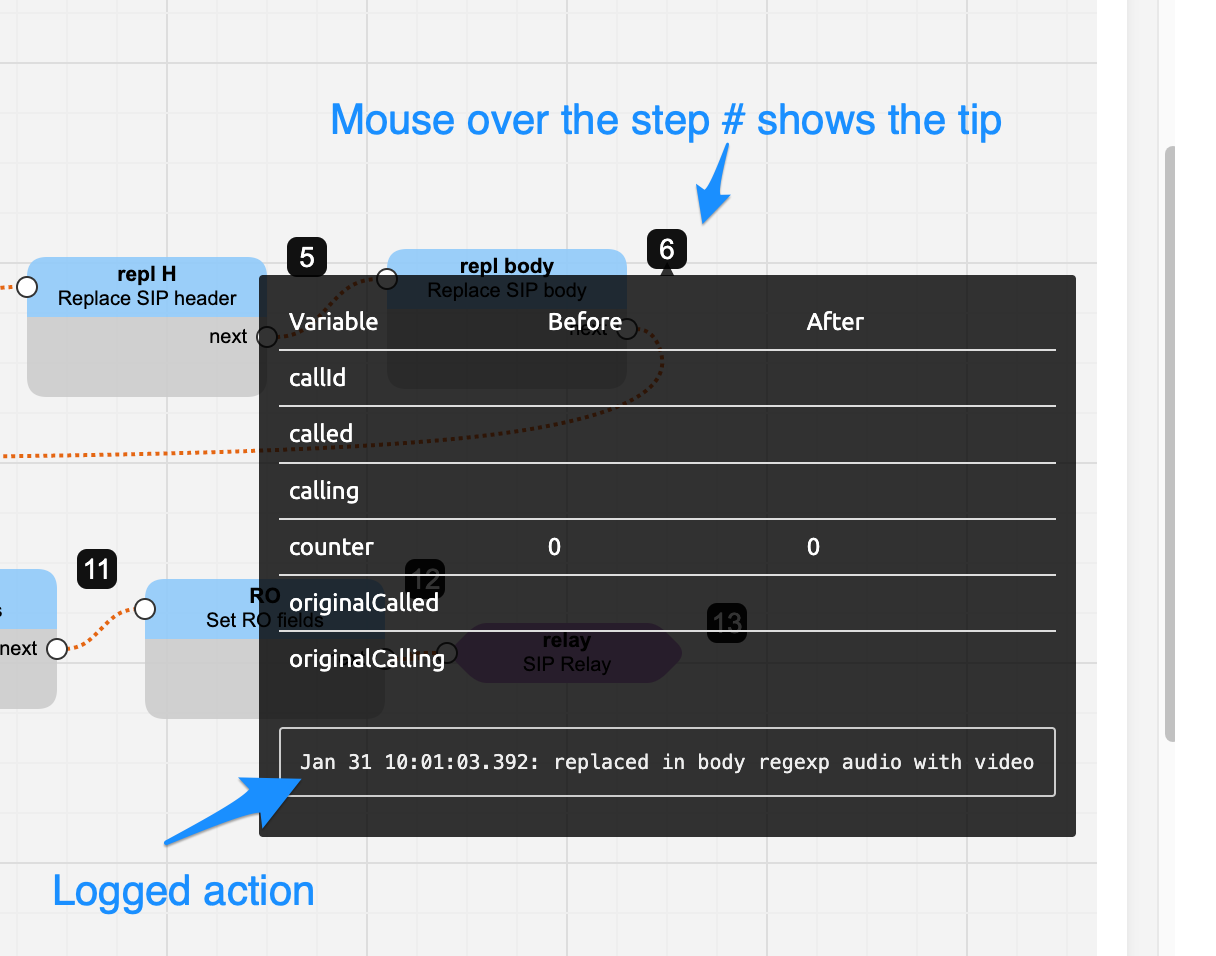
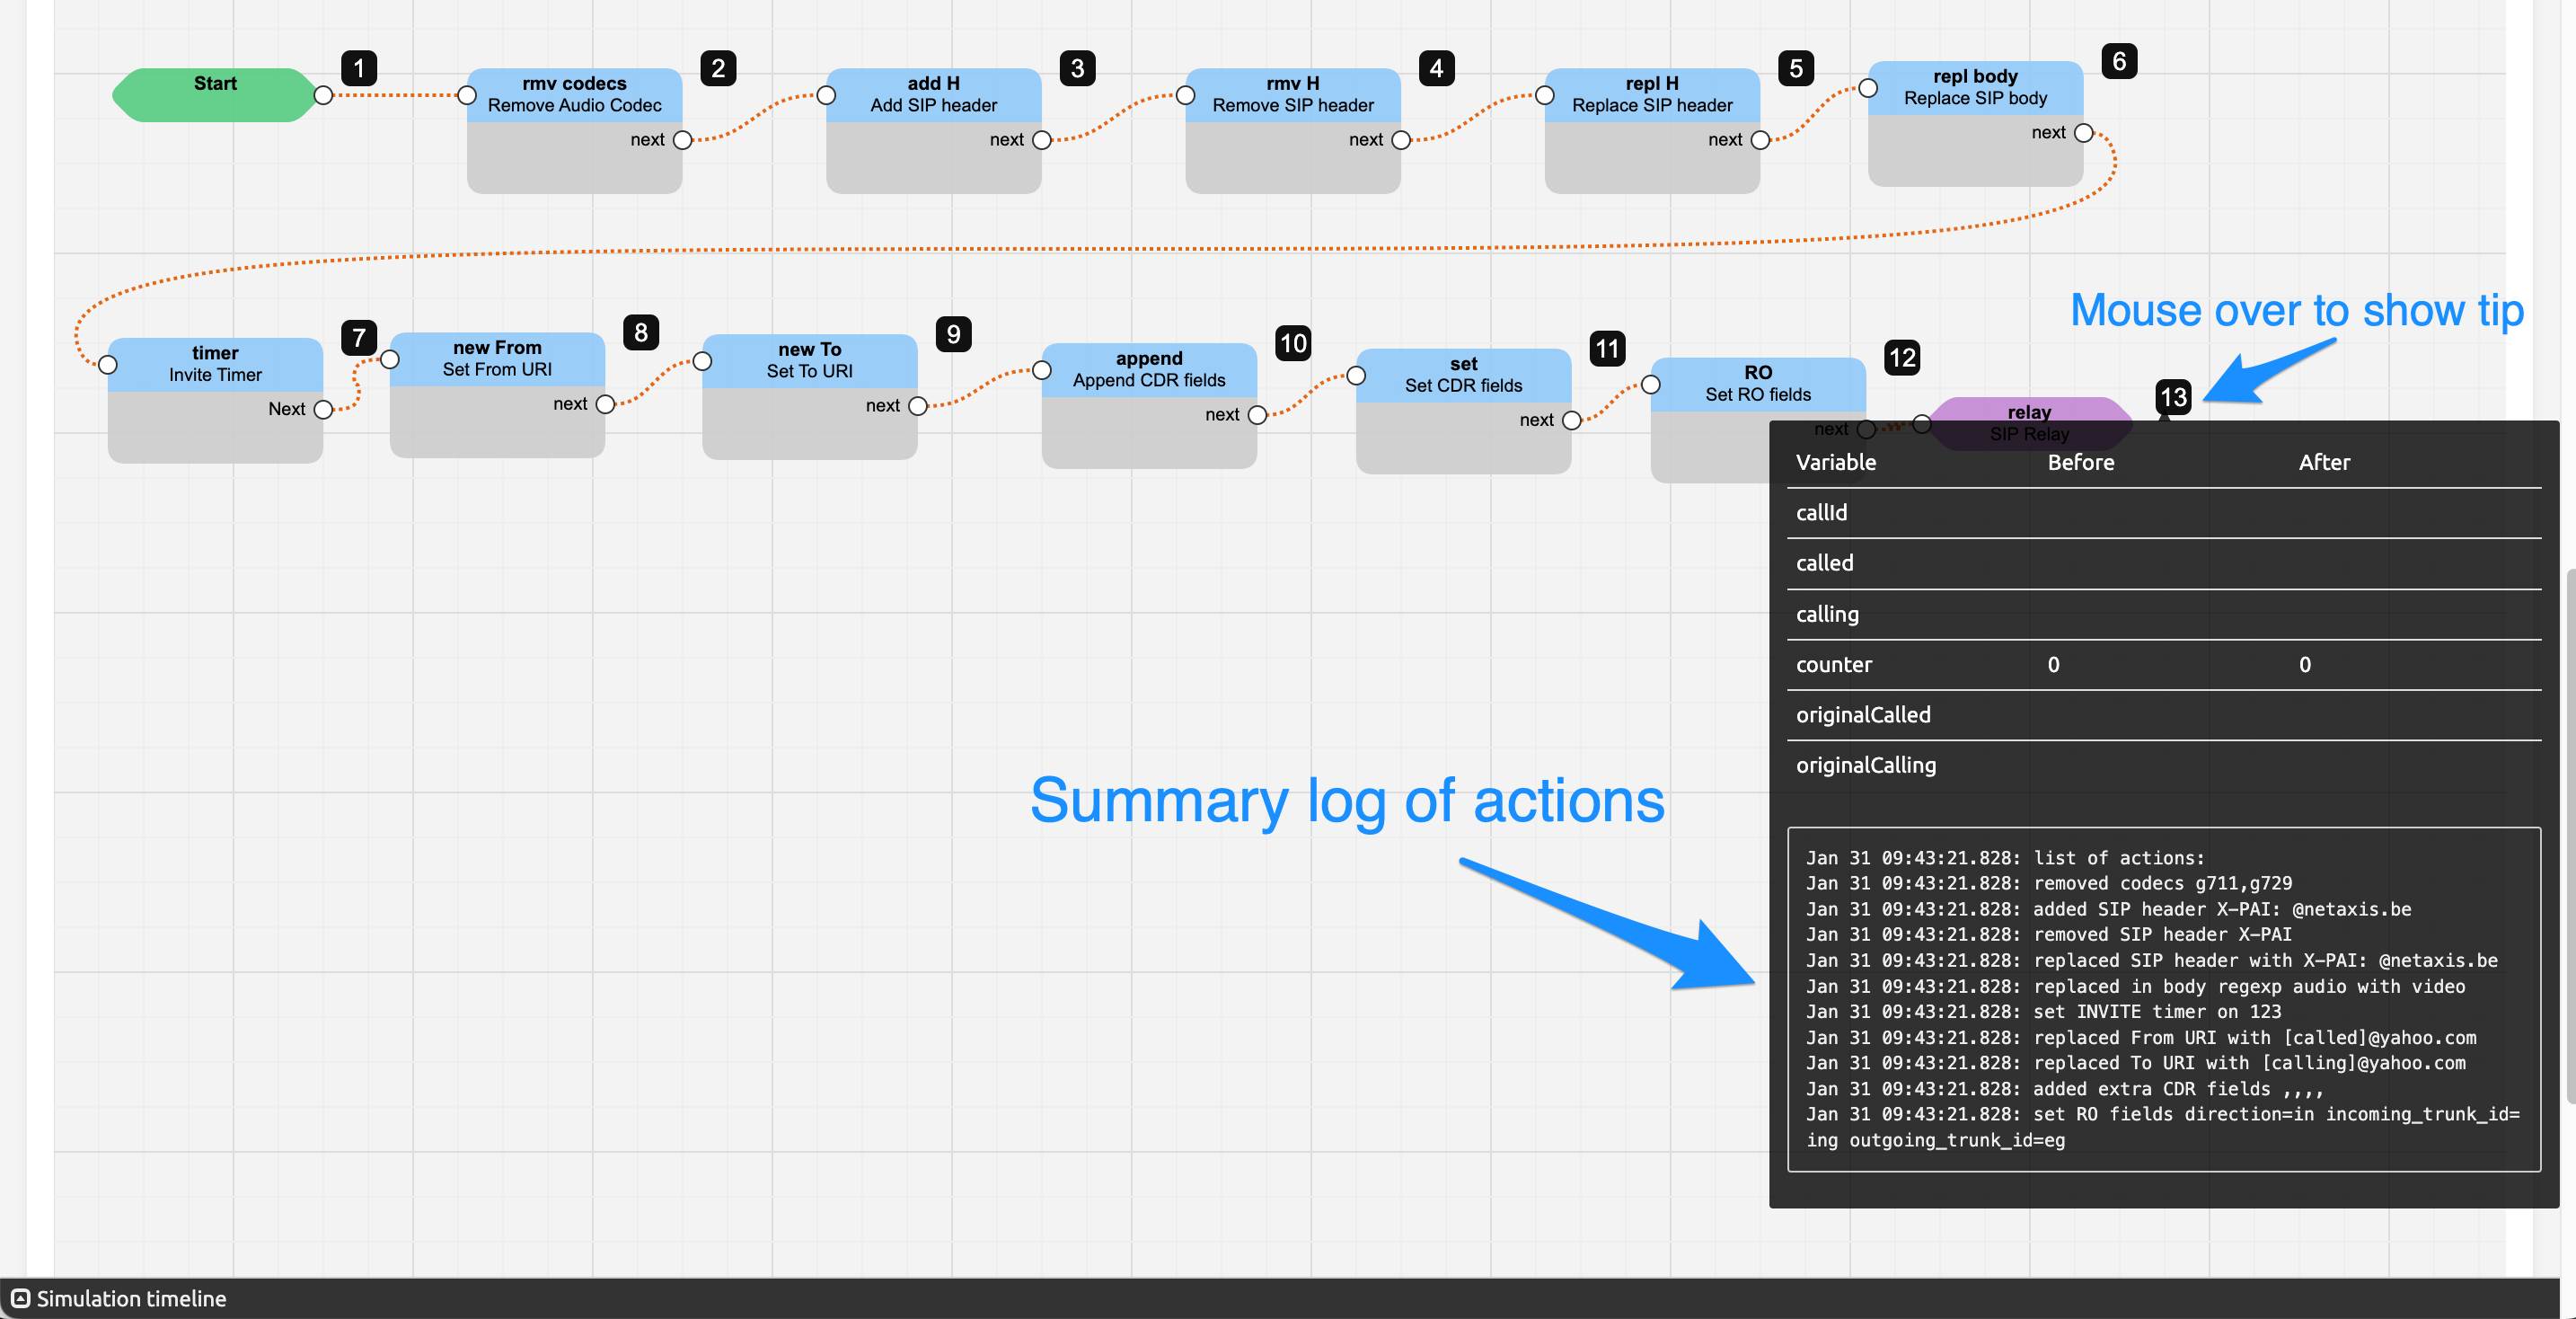
Some SIP manipulations append behind-the-scene actions which will be executed later on: if present, they are also displayed in the log summary of the output SIP node.
Mouse over the step number to see the tip of the Call Descriptor.
Click the step number to display the Call Descriptor window.
The Simulation Timeline
Click Simulation Timeline below the grid, bottom left, to display the table showing the sequence of steps, the duration for each step, the cumulative duration and the values of the processed variables.
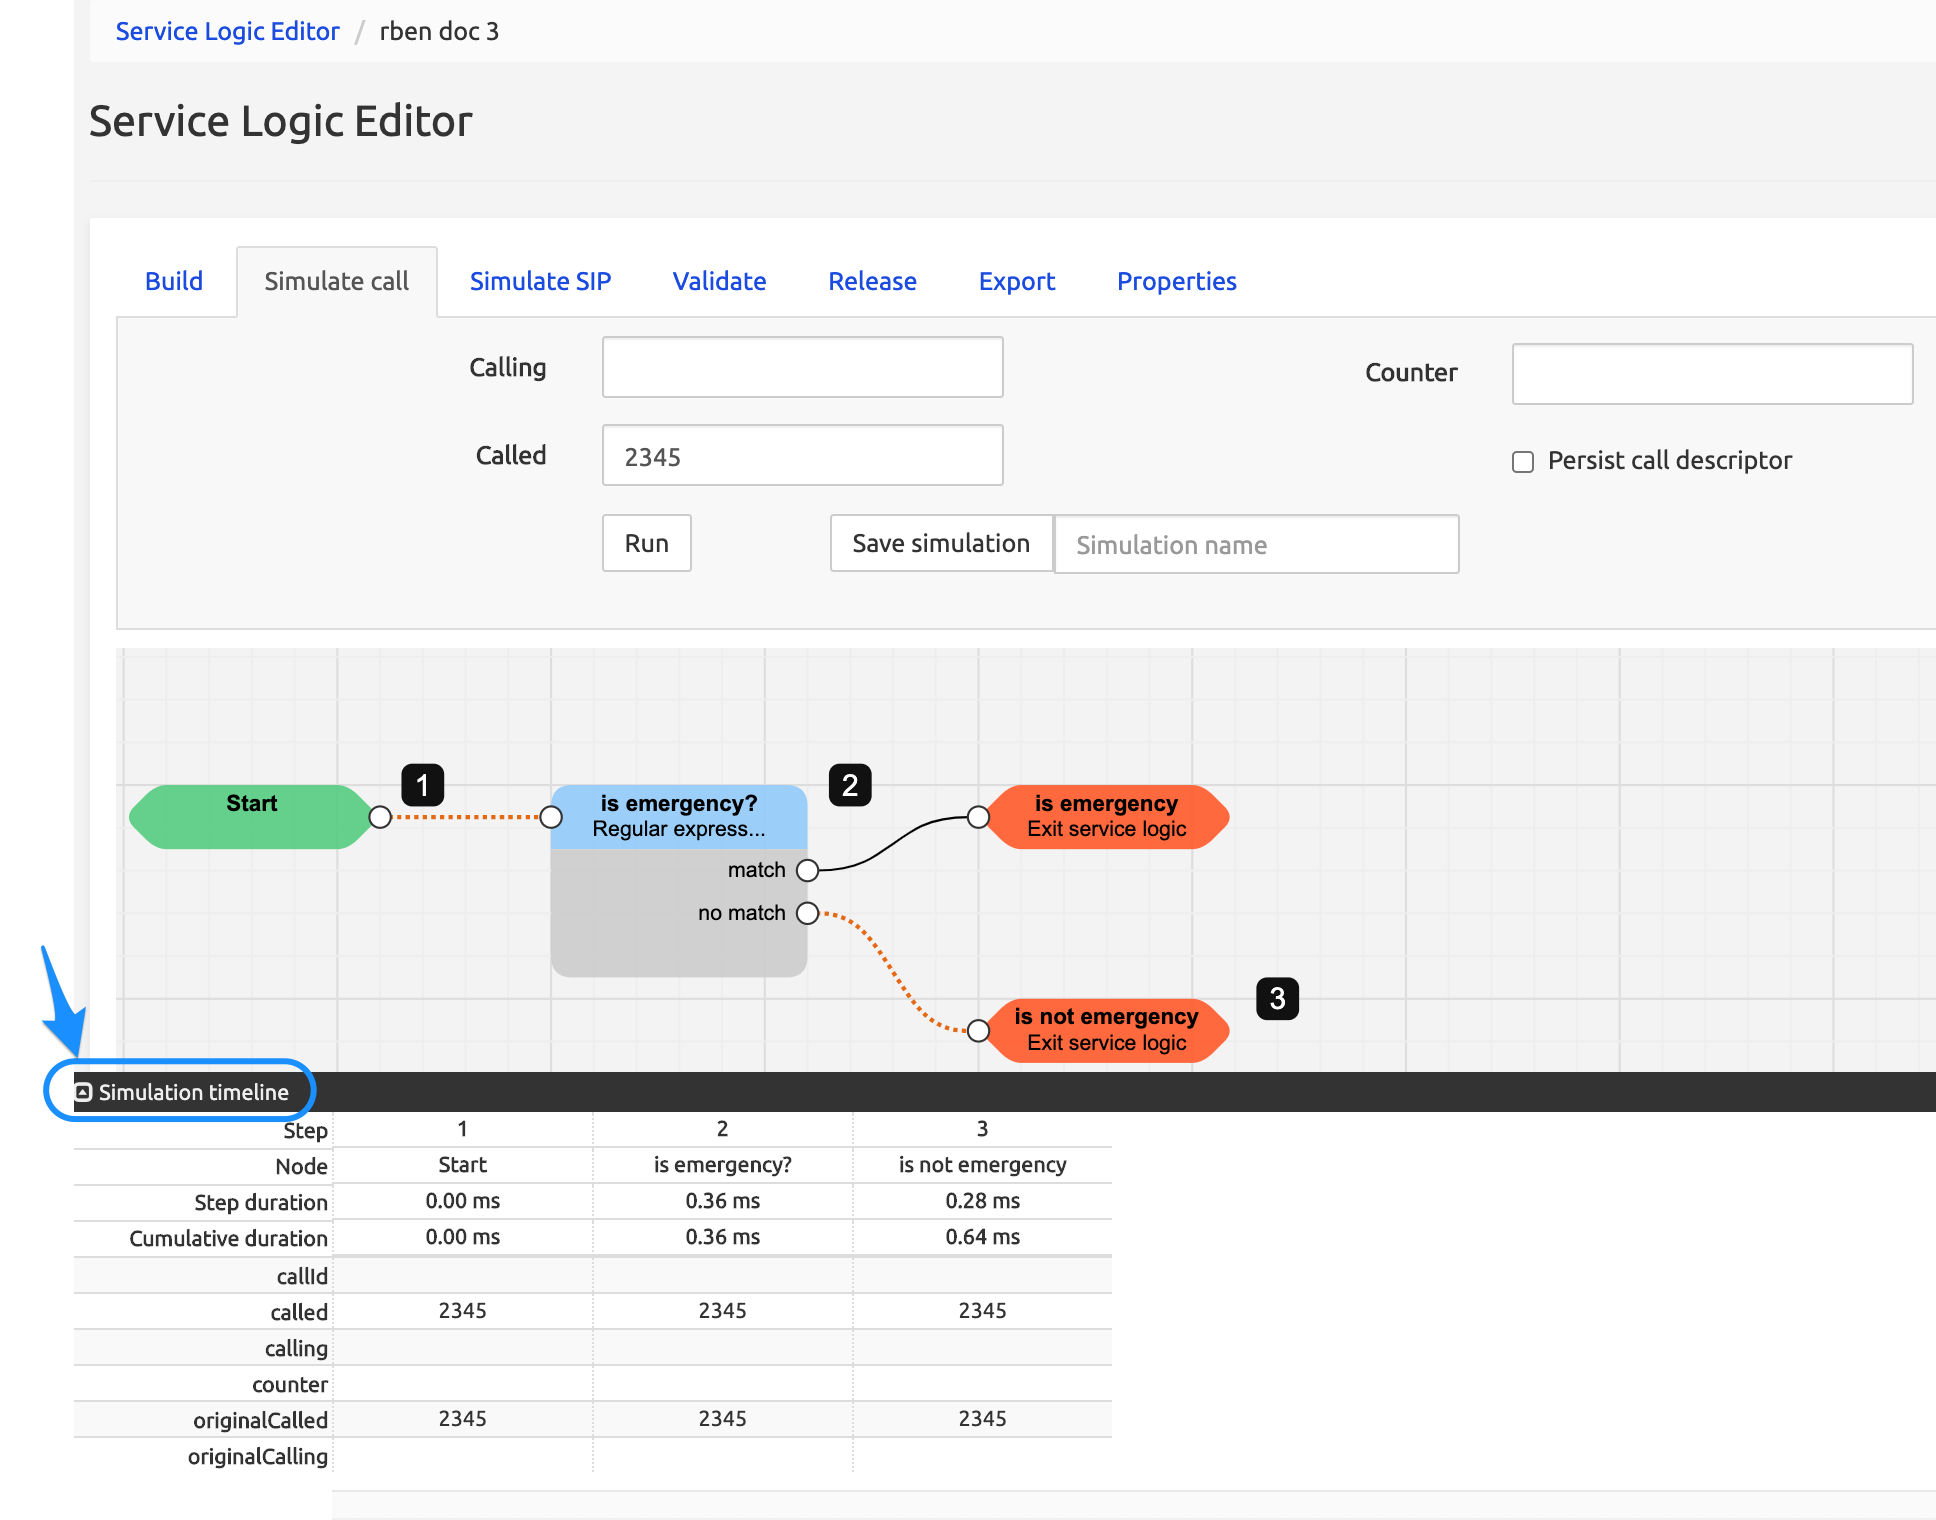
In the timeline below, the value of the variable called has been modified at step 3 and is highlighted in pink, while the variable new_variable has received at step 4 a value for the first time and is highlighted in green.

Focus on a step in the Timeline
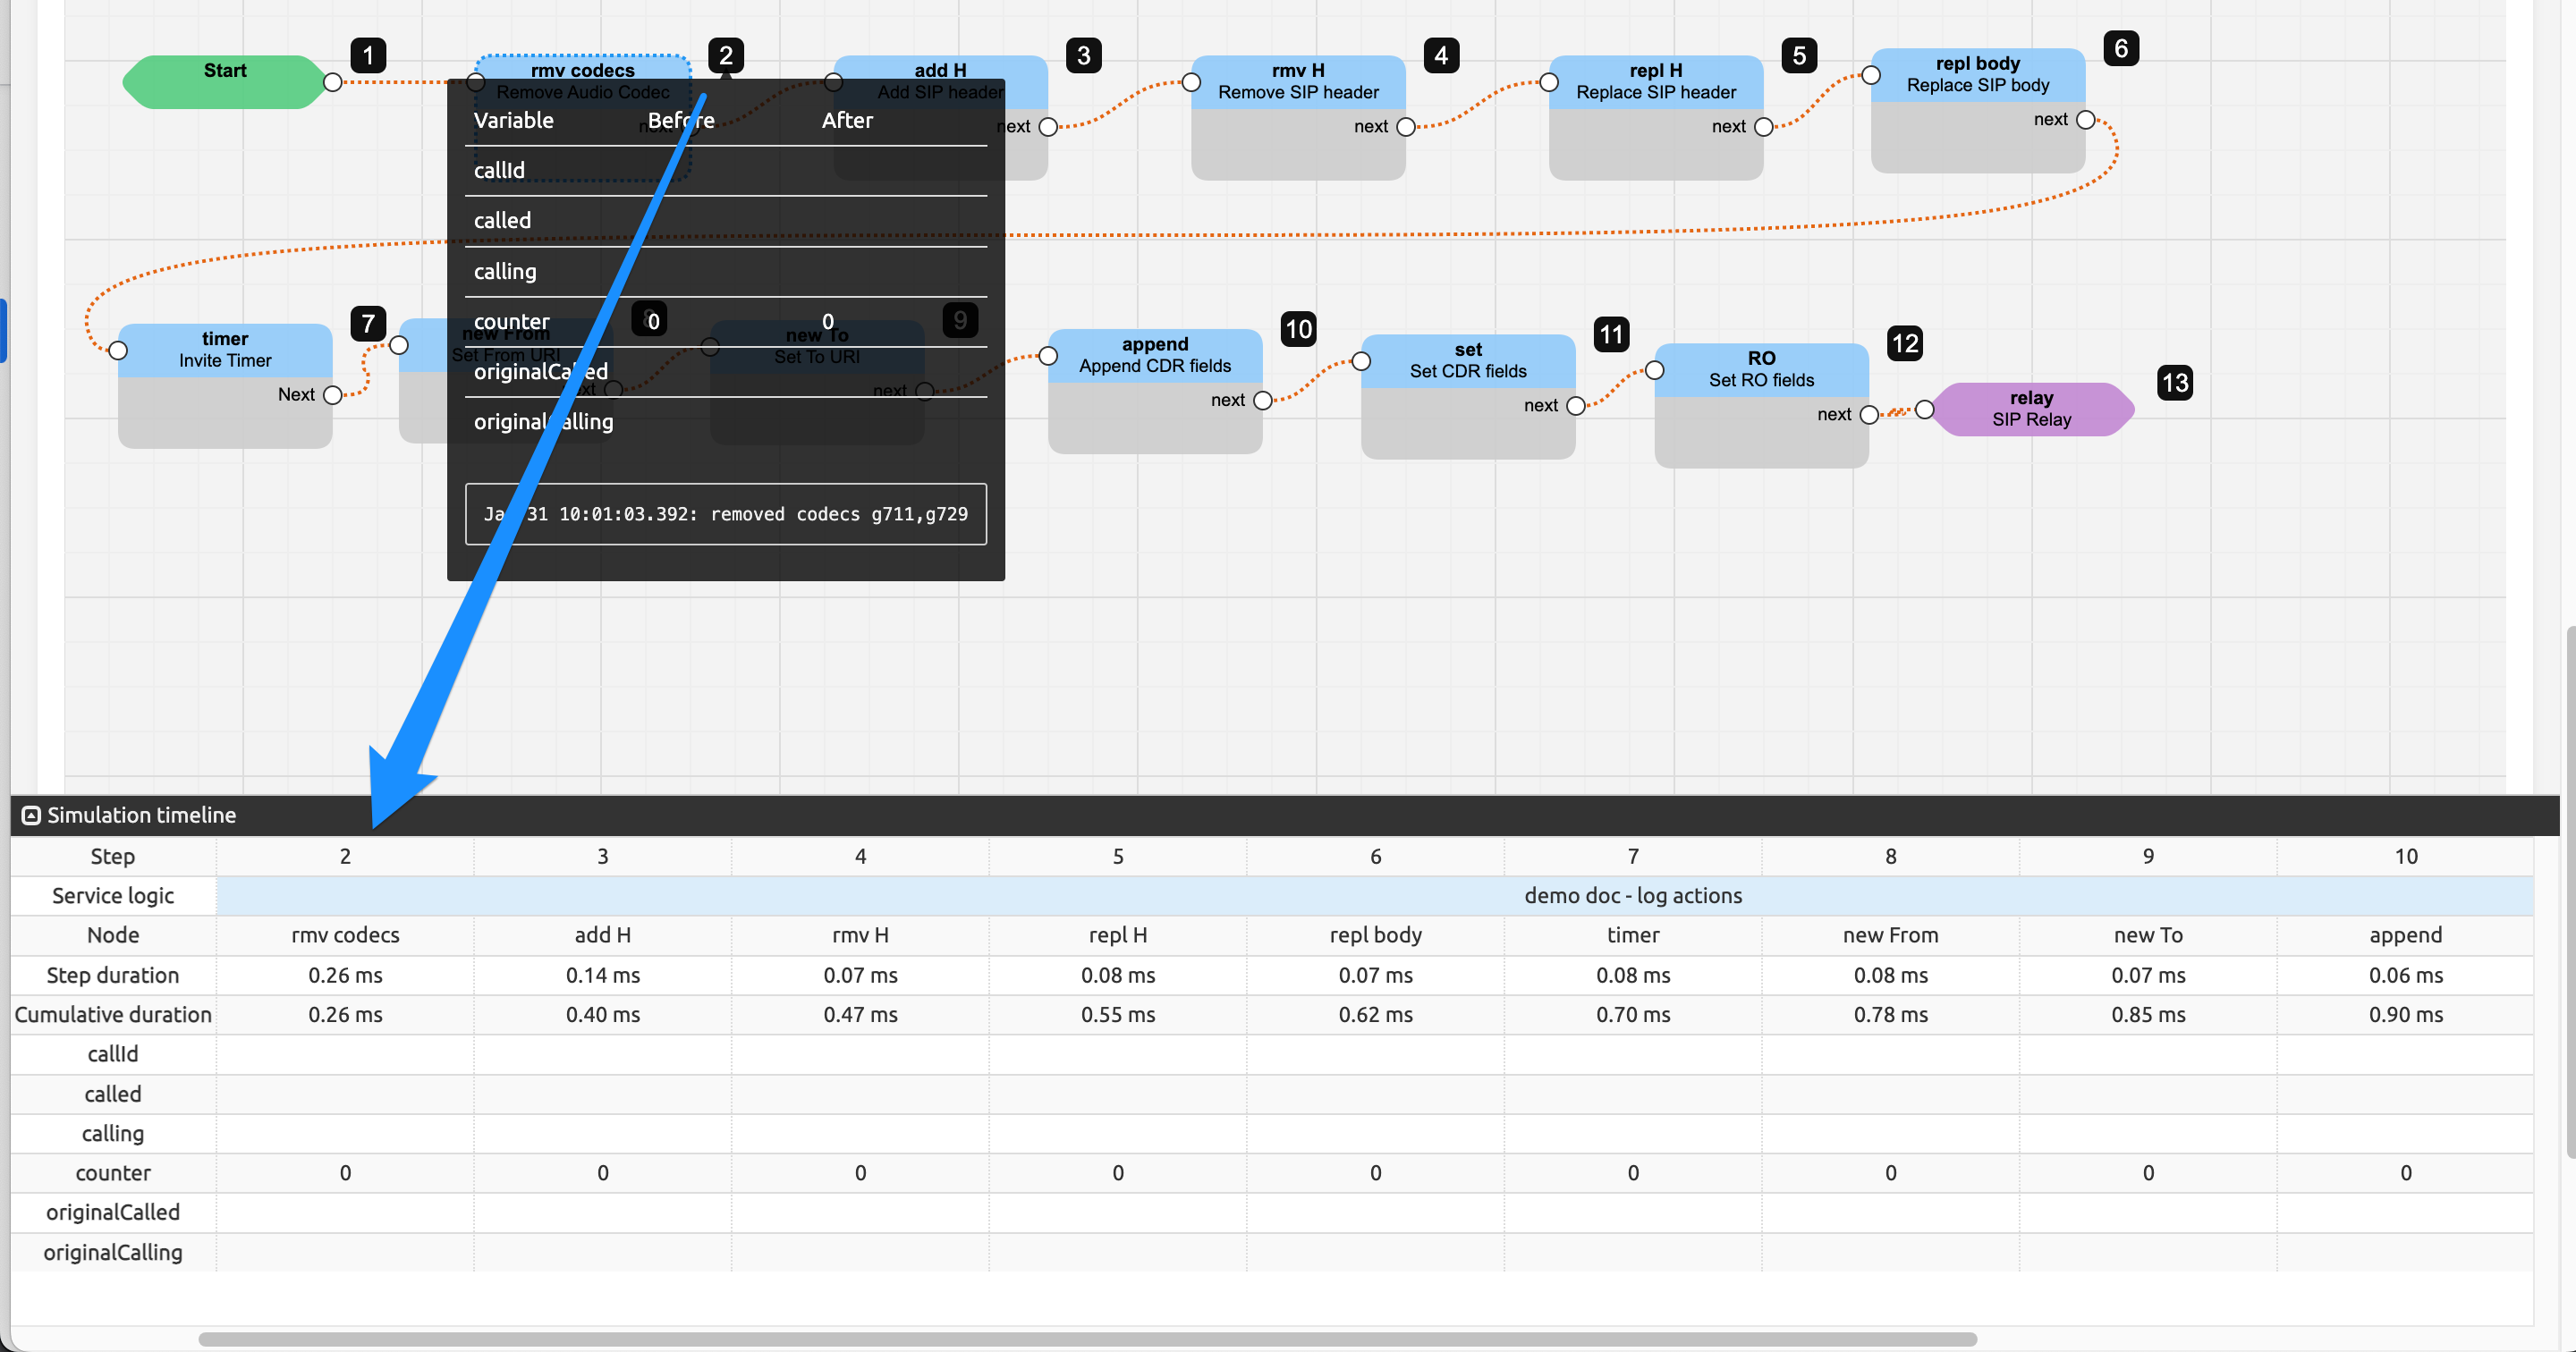
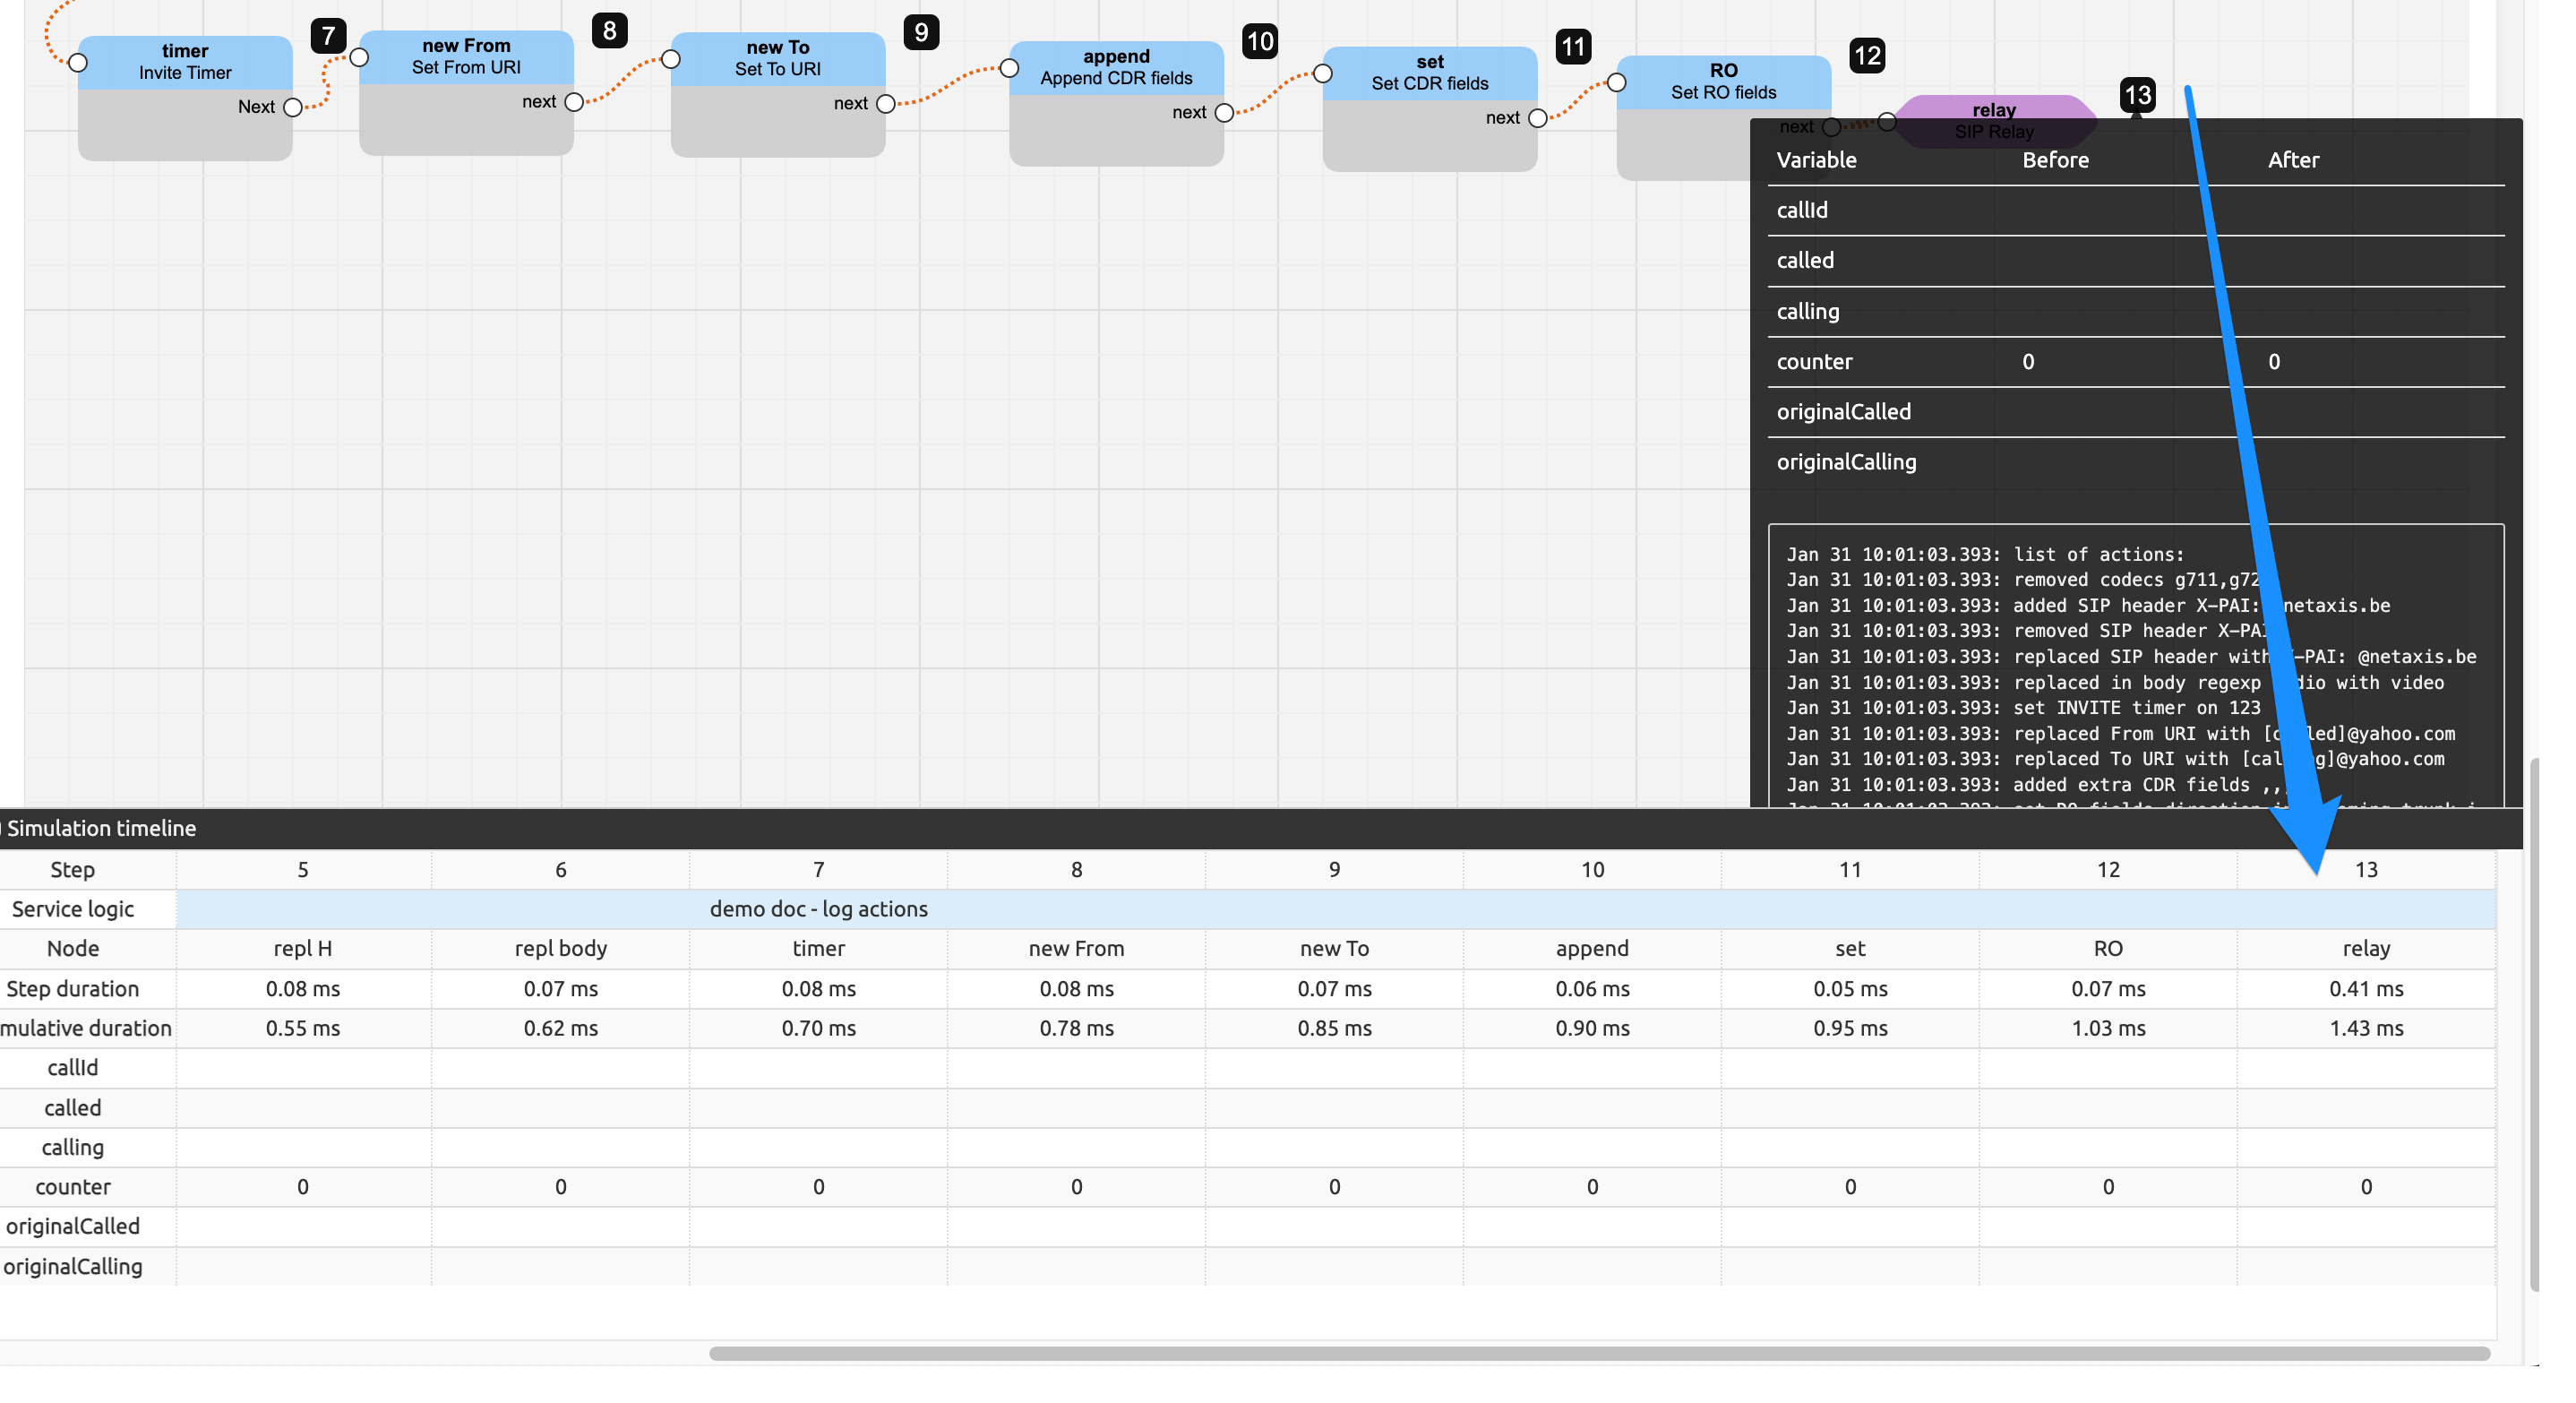
When the Timeline is shown on the screen (below the viewport), mouse over a step number in the viewport not only shows the Call Descriptor tip, but also moves the focus of the Timeline, sliding the display from this step (when possible: mouse over the last step will show it last on the line).
The focus remains on the last step invoked by the mouse over until another step is invoked.
Compare the two screens below:
Mouse over step 2: tip and timeline starting with 2, not showing steps 11 to 13.
Mouse over step 13: tip and timeline showing step 13 (last step) on the right, not showing steps 1 to 4.
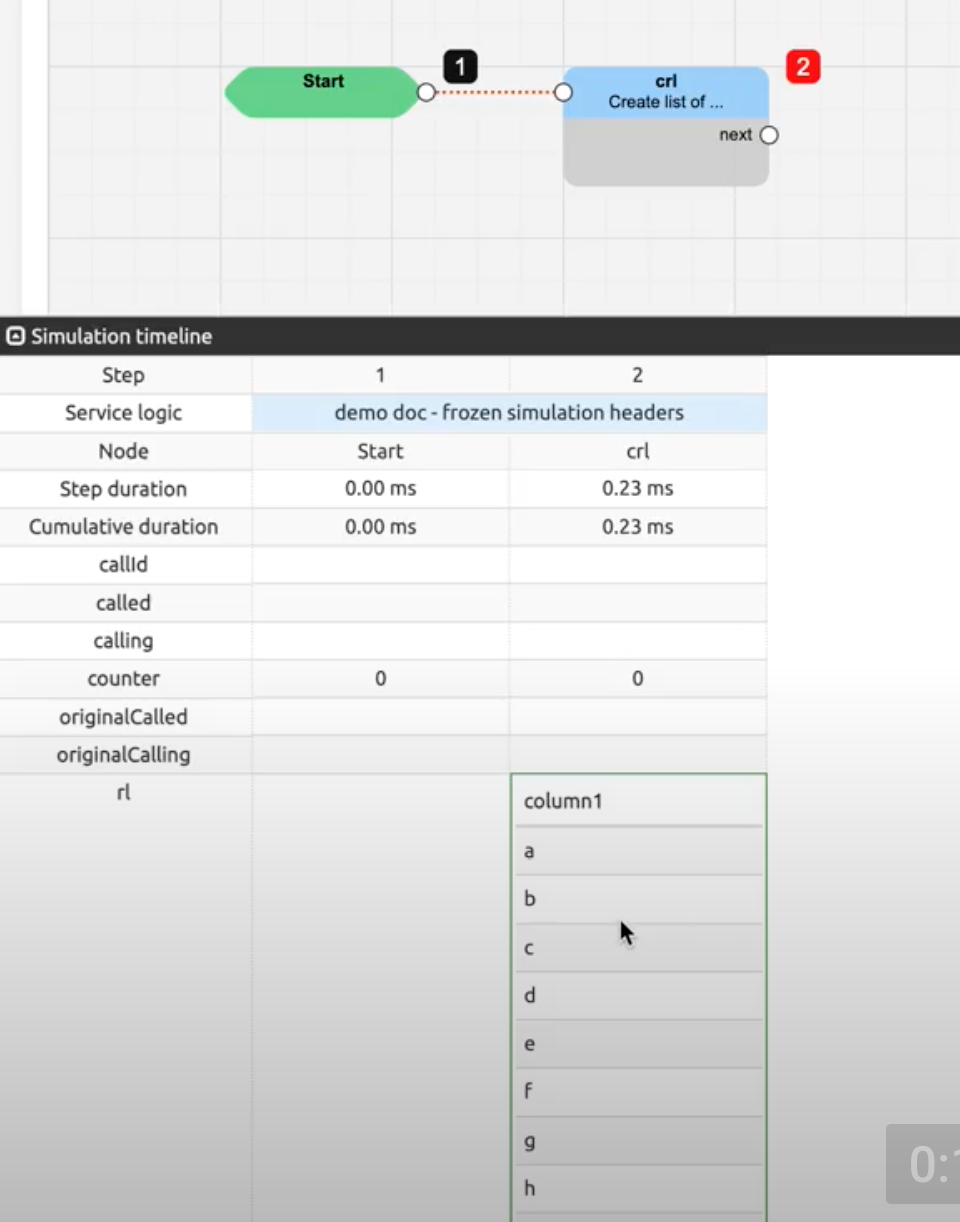
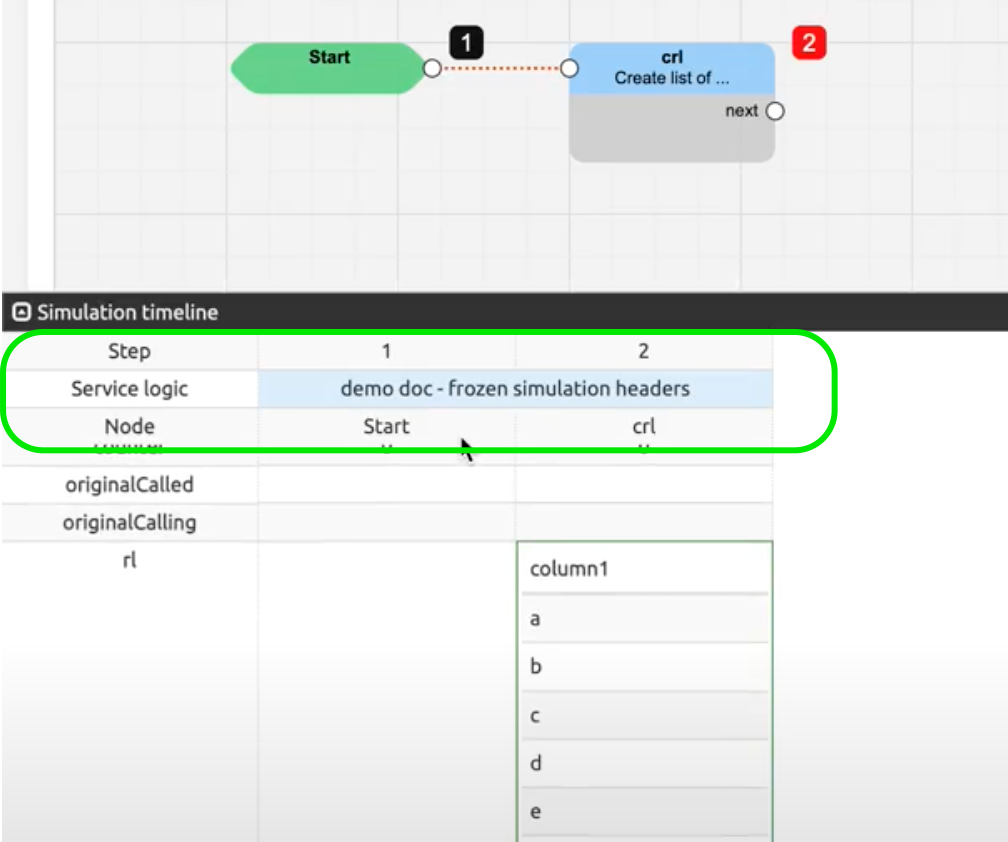
Frozen headers in Timeline table
When the number of rows in the table exceeds the table height, the top lines are kept on screen while the vertical scroll displays the last rows.
Saving a simulation
You can save a simulation if you want:
- to replay the service logic with the same values entered, and compare the new simulation with the saved one
- to load the simulation, enter different values and compare the new results with the saved ones
- to group simulations and run them as a whole in « batch » mode.
To save a simulation, enter a name for it (must be unique) and click Save button. The operation is confirmed.
INFO
Saving a simulation saves the input values (provided in Calling / Called fields), and the output values resulting from the process applied by the service logic.
No link is kept between a saved simulation and the service logic originally selected to run it. The logic behind the un-binding between simulations and service logics is that a given simulation can be used with several different service logics, for example, the releases or development versions of the same service logic.
Loading (from Validate tab) and running again (in Simulate call tab) a saved simulation with a service logic different from the one used to run and save it first will most probably end up with different results.
Similarly, replaying a simulation (from Validate tab) will use the currently selected service logic: the results are compared with the ones saved and differences, if any, are highlighted (see Validate tab below).
It may be advisable to save simulations under names that have some reference to the original service logic, and to make sure that the same original service logic that was used in the first place is the one selected when running again or replaying a saved simulation.
To load or replay a saved simulation, to group simulations or to run a simulations group, go to Validate tab (see Validate tab below.)
Simulate SIP tab
The Simulate SIP tab is similar to the Simulate Call tab above, but instead of simply providing Calling / Called values as input for a simulation, it allows defining the following elements:
Source (IP) address and port
Destination (IP) address and port
A full SIP message to be processed by the service logic
Operational conditions of the SIP Agents
Custom variables: set additional variables for the simulation
Counter: set it to 0 to simulate a first call attempt; set it to 1, 2,... to simulate crank-back calls
Persistent call descriptor: when doing crank-back simulations (counter=N), set this flag on to be able to use a call descriptor calculated by previous runs (counter=0,...,N-1).
By default, the simulation runs in the service logic you are in. It is also possible to simulate starting from the parent service logic (up to the main one).
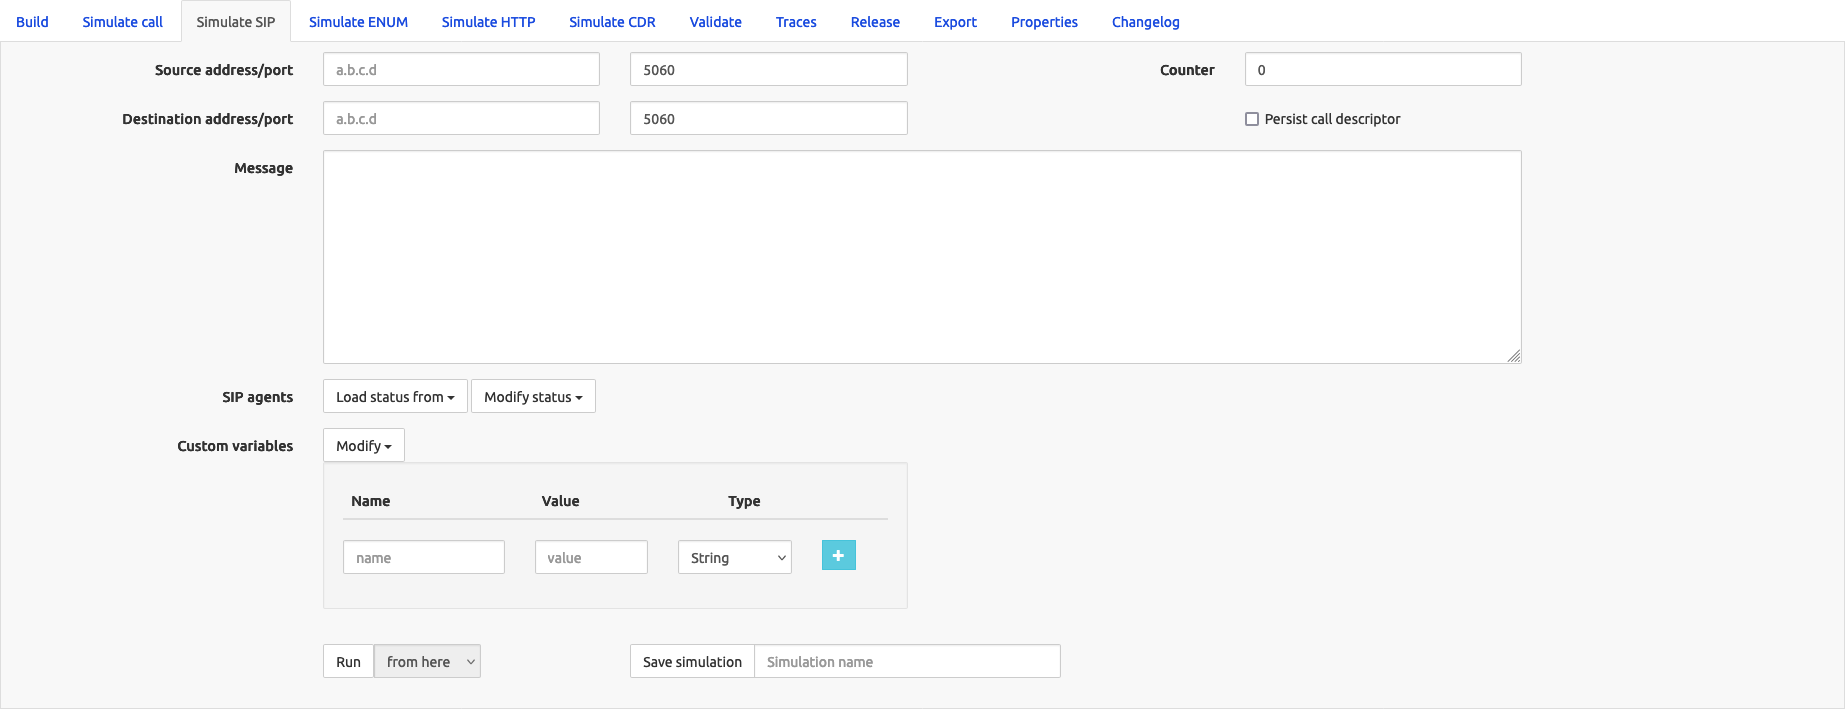
As SIP operations are being processed, the status of SIP Agents can be set as expected by the operations to be performed during service logic simulation:
The Load status from drop-down list shows the Call Processing nodes present and allows selecting one to load the SIP Agents status from:

The Modify status drop-down list allows manually setting the status of each of the SIP Agents monitored by the Call Processing nodes.

The operations (Run, Save Simulation) and information returned (Call Descriptors, Simulation Timeline) behave exactly as described above in Simulate call tab .
Simulate ENUM tab
The Simulate ENUM tab is useful to test ENUM-related service logic. It allows defining the following elements:
- Number/zone: phone number and enum zone (e.g. e164.arpa)
By default, the simulation runs in the service logic you are in. It is also possible to run the simulation from the parent service logic (up to the main one).
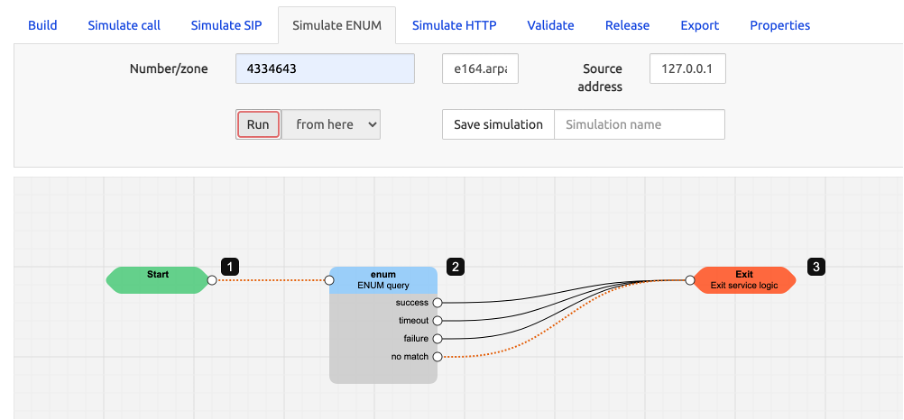
You can save the simulation inputs and outcomes.
Simulate HTTP tab
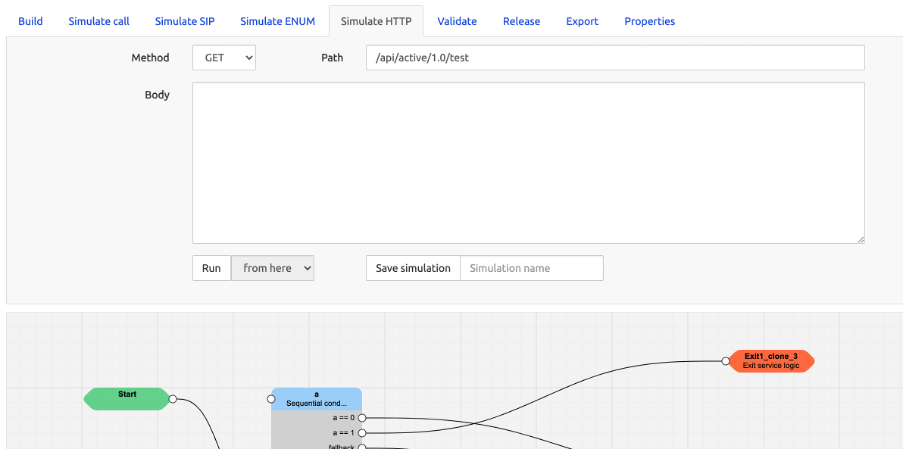
The Simulate HTTP tab is useful to test HTTP-related service logic. It allows defining the following elements:
Method: GET, POST, PUT, PATCH, DELETE
Path
Body: Some methods require a body to be defined with the content of the request
By default, the simulation runs in the service logic you are in. It is also possible to run the simulation from the parent service logic (up to the main one).
Simulate CDR tab
The Simulate CDR tab allows applying the operations of a service logic to a single CDR used as input, and optionally to output the results to an Output CDR node (see separate SRE Nodes Description document).
The only possible input for the CSV row field is a single line that is the CDR in comma-separated format.
Clicking Run executes the service logic, showing the steps in numbered black squares in the grid.
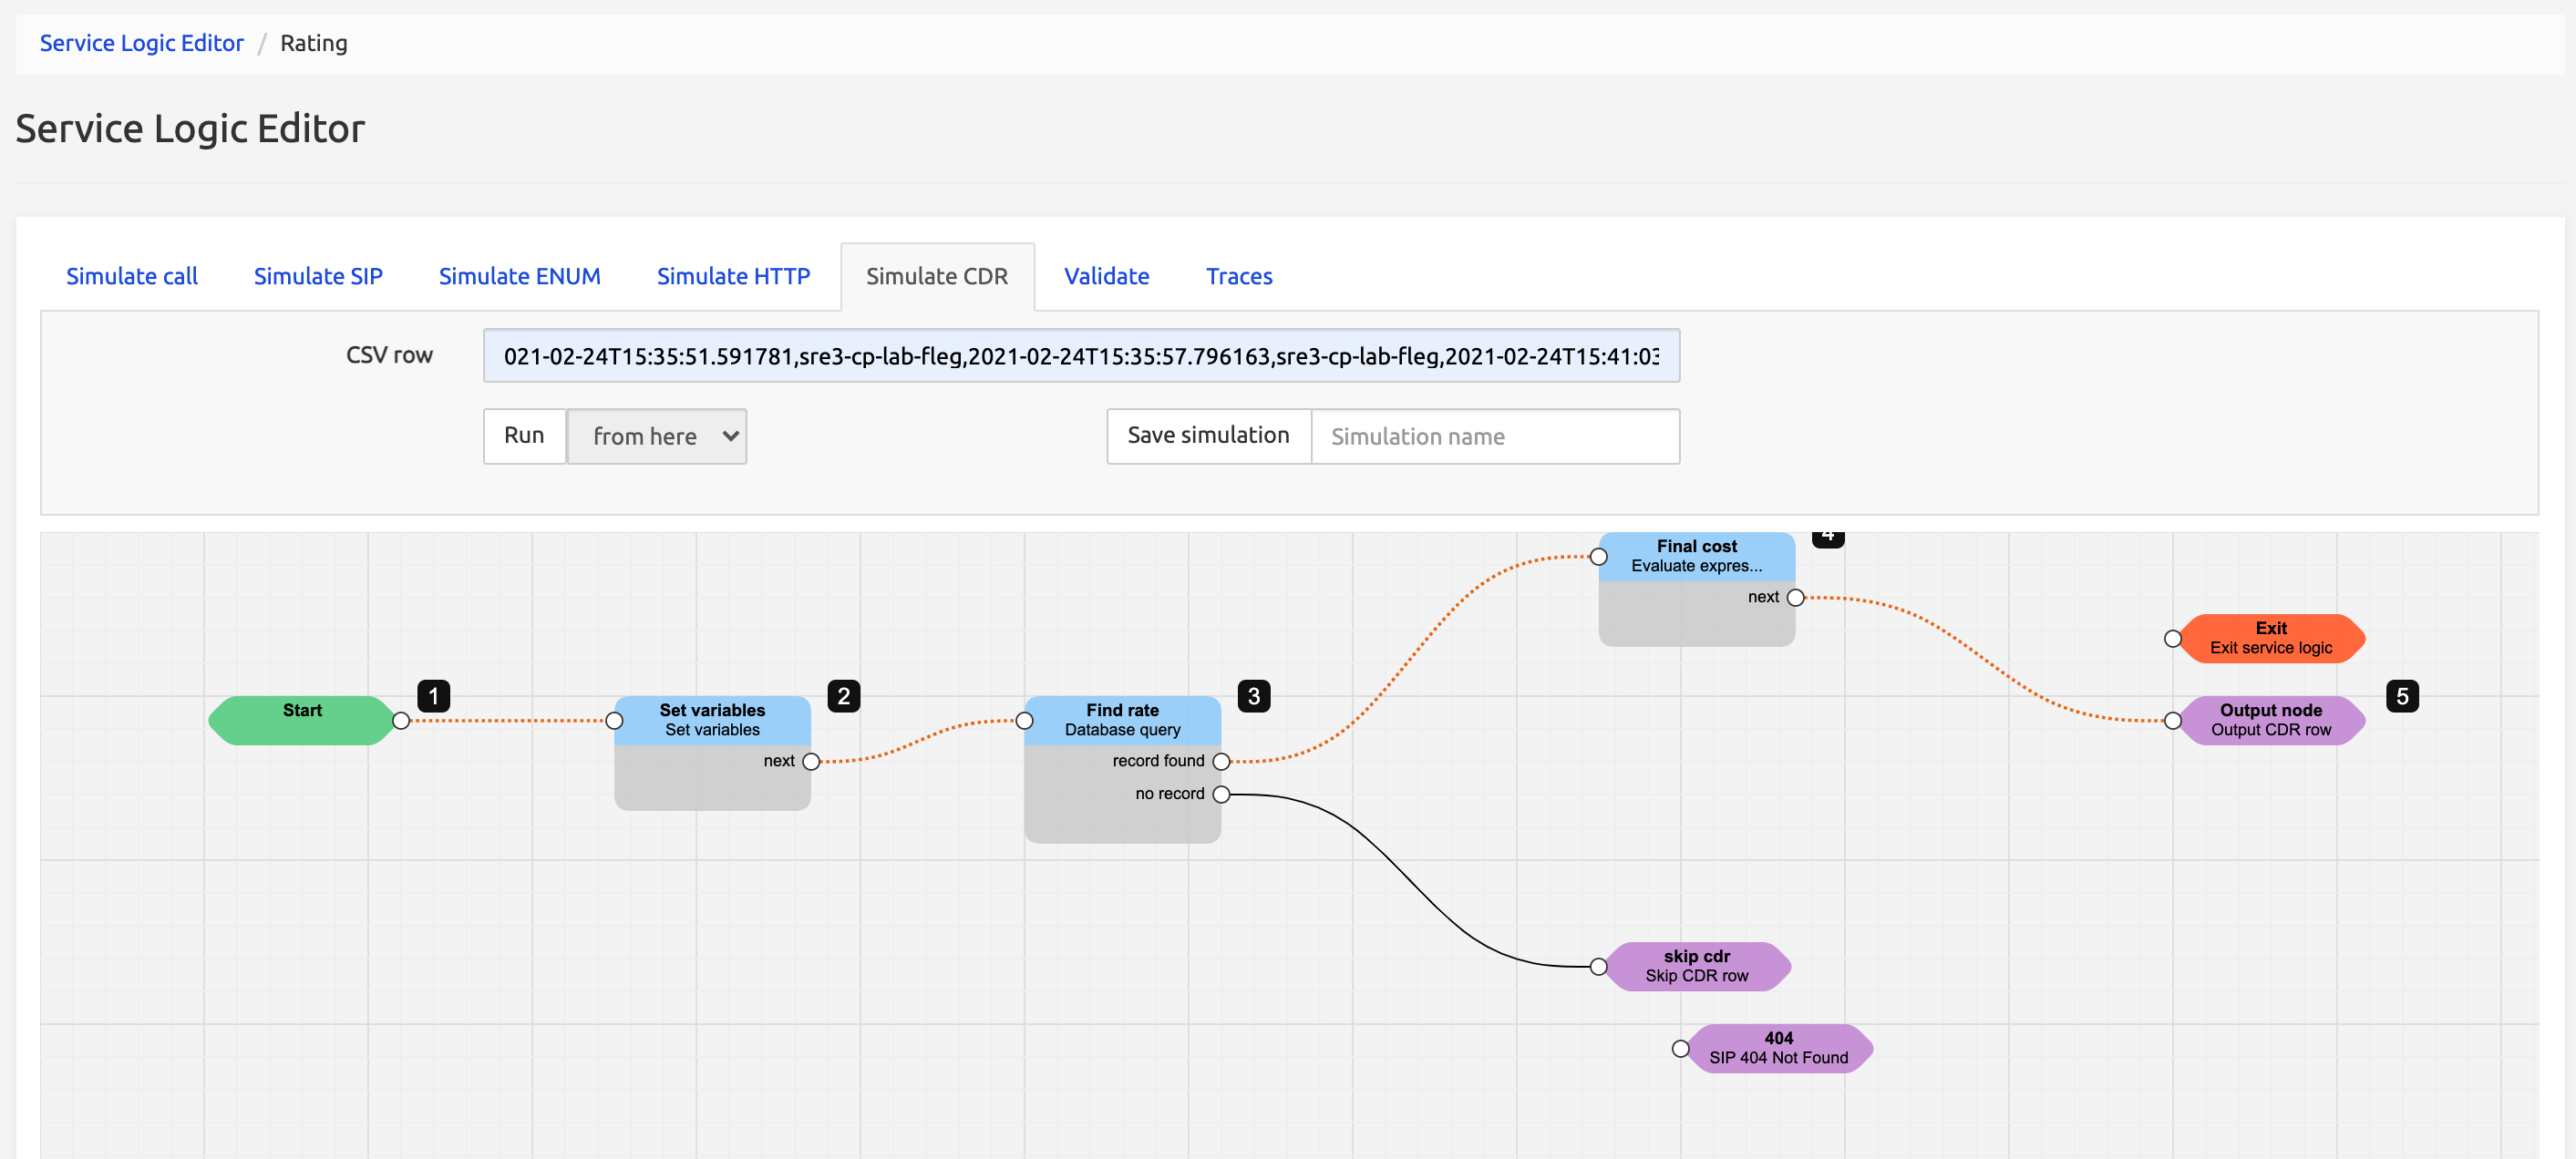
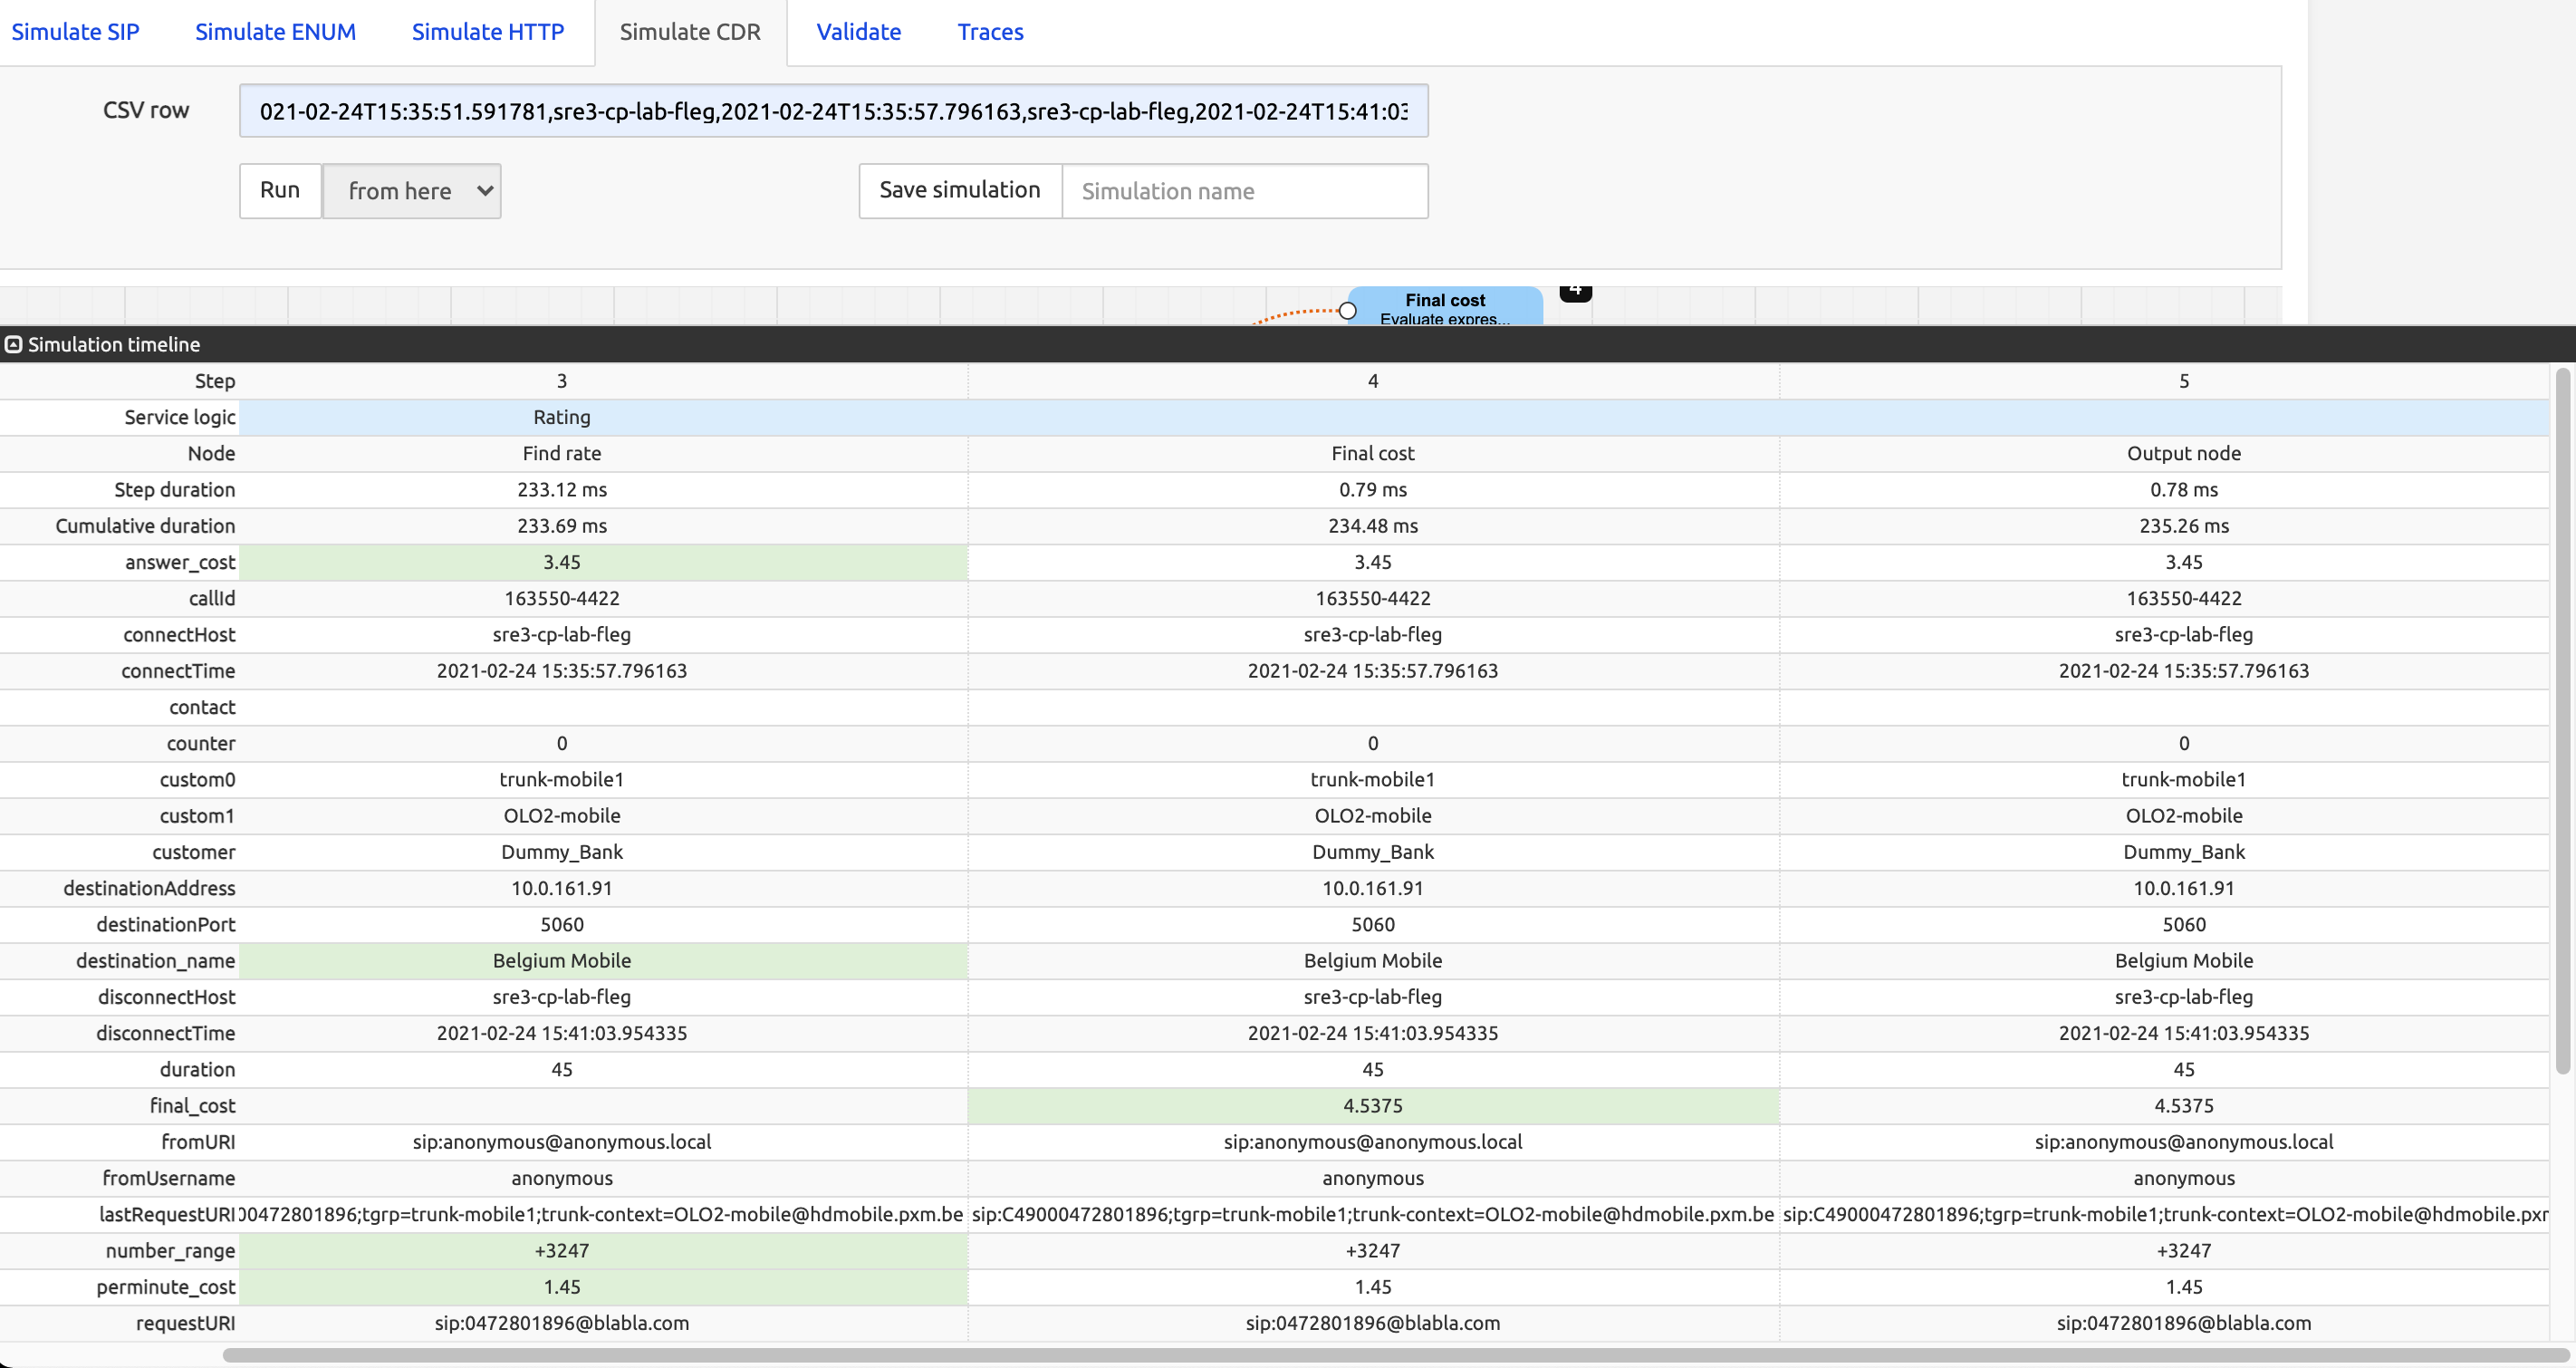
At the bottom, the Simulation Timeline button displays the successive values of each variable in each step. Cells with a green background show values changed from the previous step. A horizontal scroll bar at the bottom allows navigating the Simulation timeline columns, which correspond to the steps in the grid.
Example of a source CDR
2021-02-24T15:35:51.591781,sre3-cp-lab-fleg,2021-02-24T15:35:57.796163,sre3-cp-lab-fleg,2021-02-24T15:41:03.954335,sre3-cp-lab-fleg, 0,163550-4422,0,sip:anonymous@anonymous.local,anonymous,sip:0472801896@blabla.com, +32472801896,sip:0472801896@blabla.com,0472801896, sip:C49000472801896;tgrp=trunk-mobile1;trunk-context=mobile@customer.be, 10.0.161.170,5060,10.0.161.91,5060,,,,,,,,,,,,,,,,,,,,,,,,,,,,,,, trunk-mobile1,OLO2-mobile
Simulate Media tab
The Simulate Media tab is useful to test Media-related service logic. It allows defining the following elements:
- Calling: phone number of the caller.
- Event: select which received event to simulate, it can be one of:
- START: this event is fired when a new call is received by the media processor.
- DTMF: this event is fired when a tone is received.
- PLAYBACK_FINISHED: this event is fired when playback is finished.
- ORIGINATED: this event is fired when originating call is successful.
- TIMEOUT: this event is fired when a timeout was set for this call and this timeout expired.
- Digit: only enabled when event is DTMF. Select which tone has been received.
- Direction: only enabled when event is DTMF. With this control you can simulate if the tone was sent from the caller or from the called party.
- Playback: only enabled when event is PLAYBACK_FINISHED. This entry can be filled with the sound name that has finished playing.
Validate tab
The Validate tab is the location in the SRE GUI where you can manage saved simulations, to load and run them, replay them, to associate them into groups and to run groups of simulations (so to speak, in « batch » mode).
INFO
Remember that whatever actions you take with simulations, they will be run or replayed through the currently selected service logic (the last one chosen in Service Logic List page).
Viewing saved simulations
The Validate tab displays first the list of simulations saved on the system. The usual controls allow refining the list: number of entries per page (Show nn entries, top left) , Search field (top right), navigation buttons (bottom right).
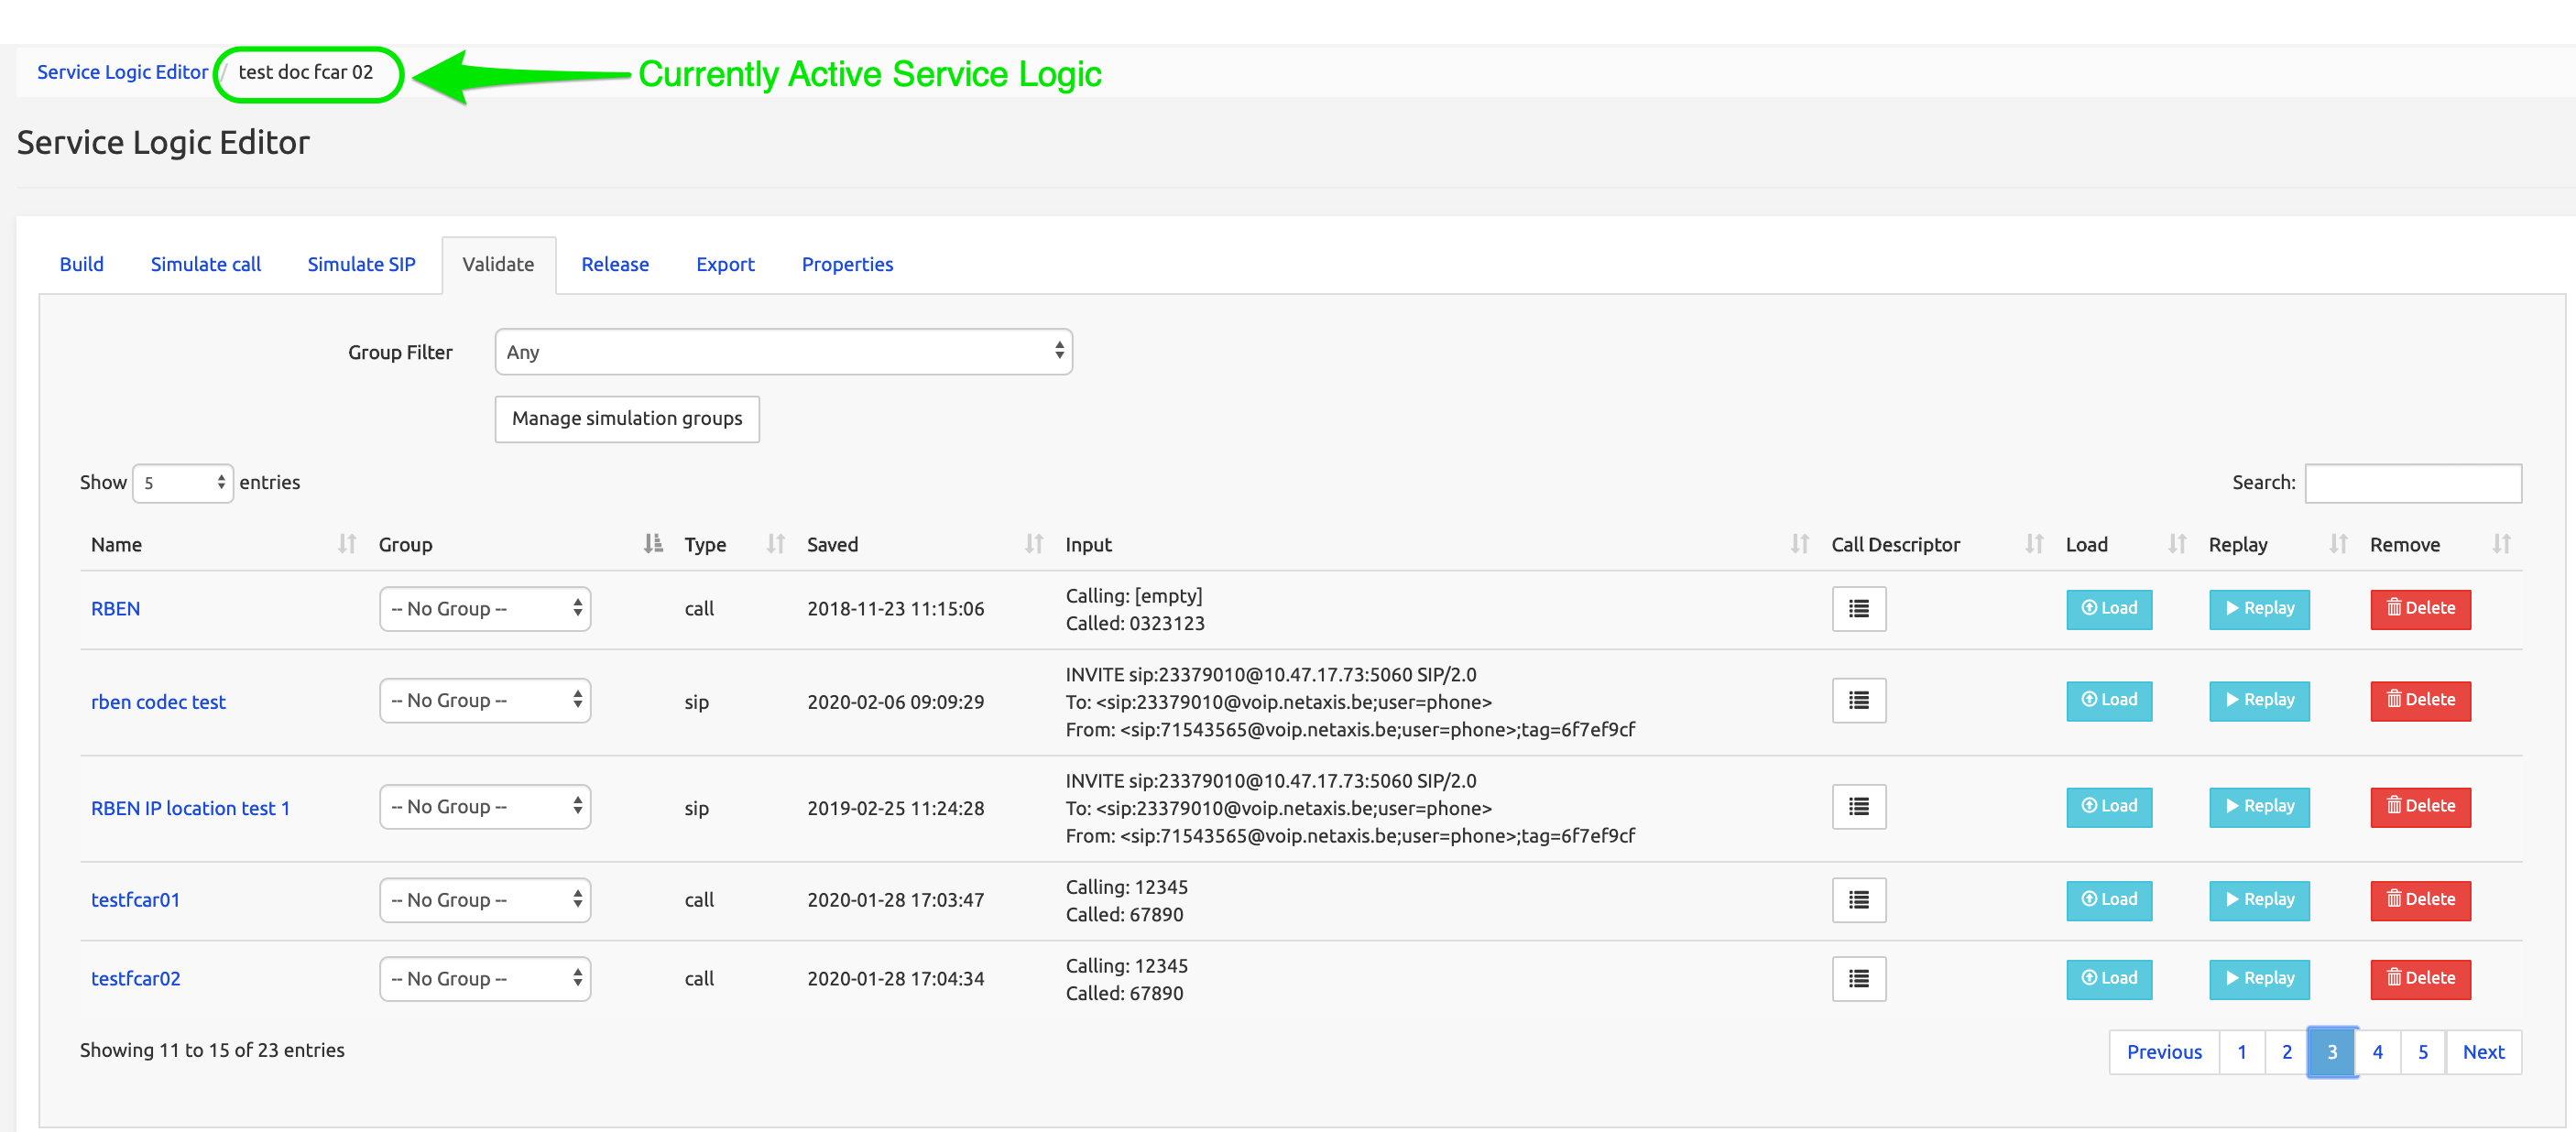
The information is presented in the following columns:
Name: the name used to save the simulation (not: the name of the service logic)
Group: the name of the simulations group the simulation belongs to (if any). You will use this list of groups to associate a simulation with a group.
Type:
call(a simple call simulation run and saved from the Simulate call tab), orsip(a SIP simulation run and saved from the Simulate SIP tab).Saved: the date when the simulation has been saved.
Input: either the Calling / Called values used as input for a Call Simulation, or the SIP message used as input for a SIP Simulation.
Call Descriptor: the full list of variables and values processed by the service logic, shown in two tables: Input (values provided at Start) and Output (after service logic execution, the resulting values and result returned to the call originator)
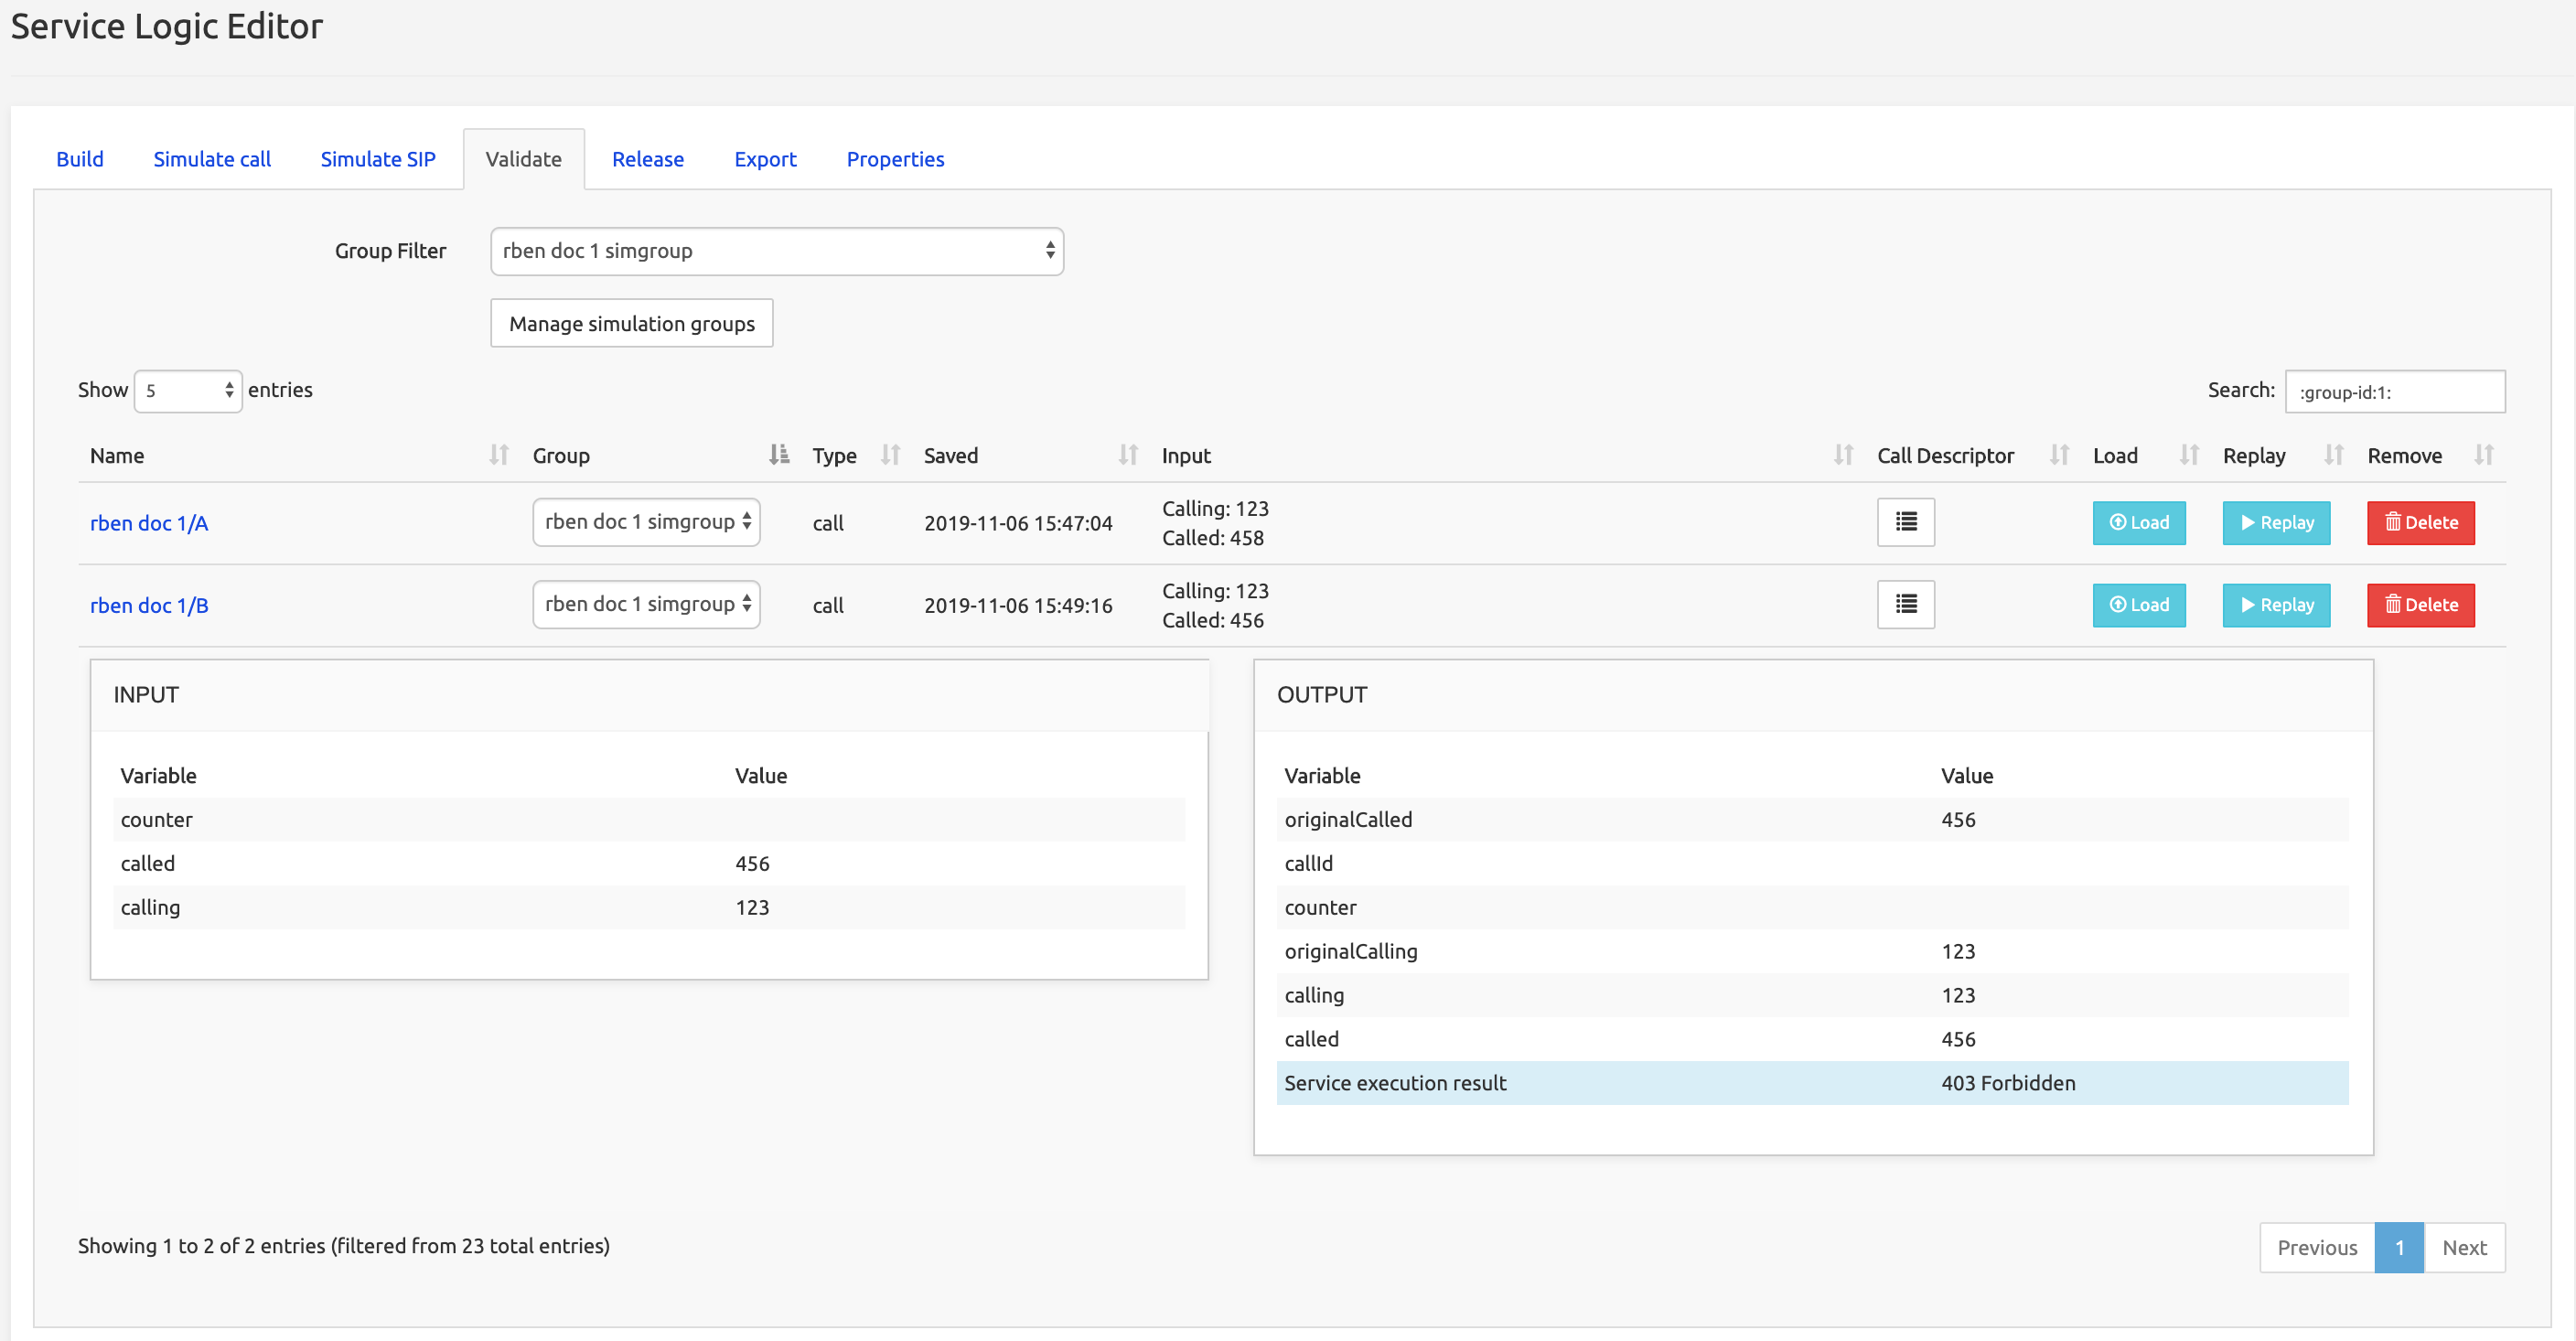
Load button: loads the simulation in the corresponding Simulate Call tab or Simulate SIP tab, to re-run it there (no results comparison).
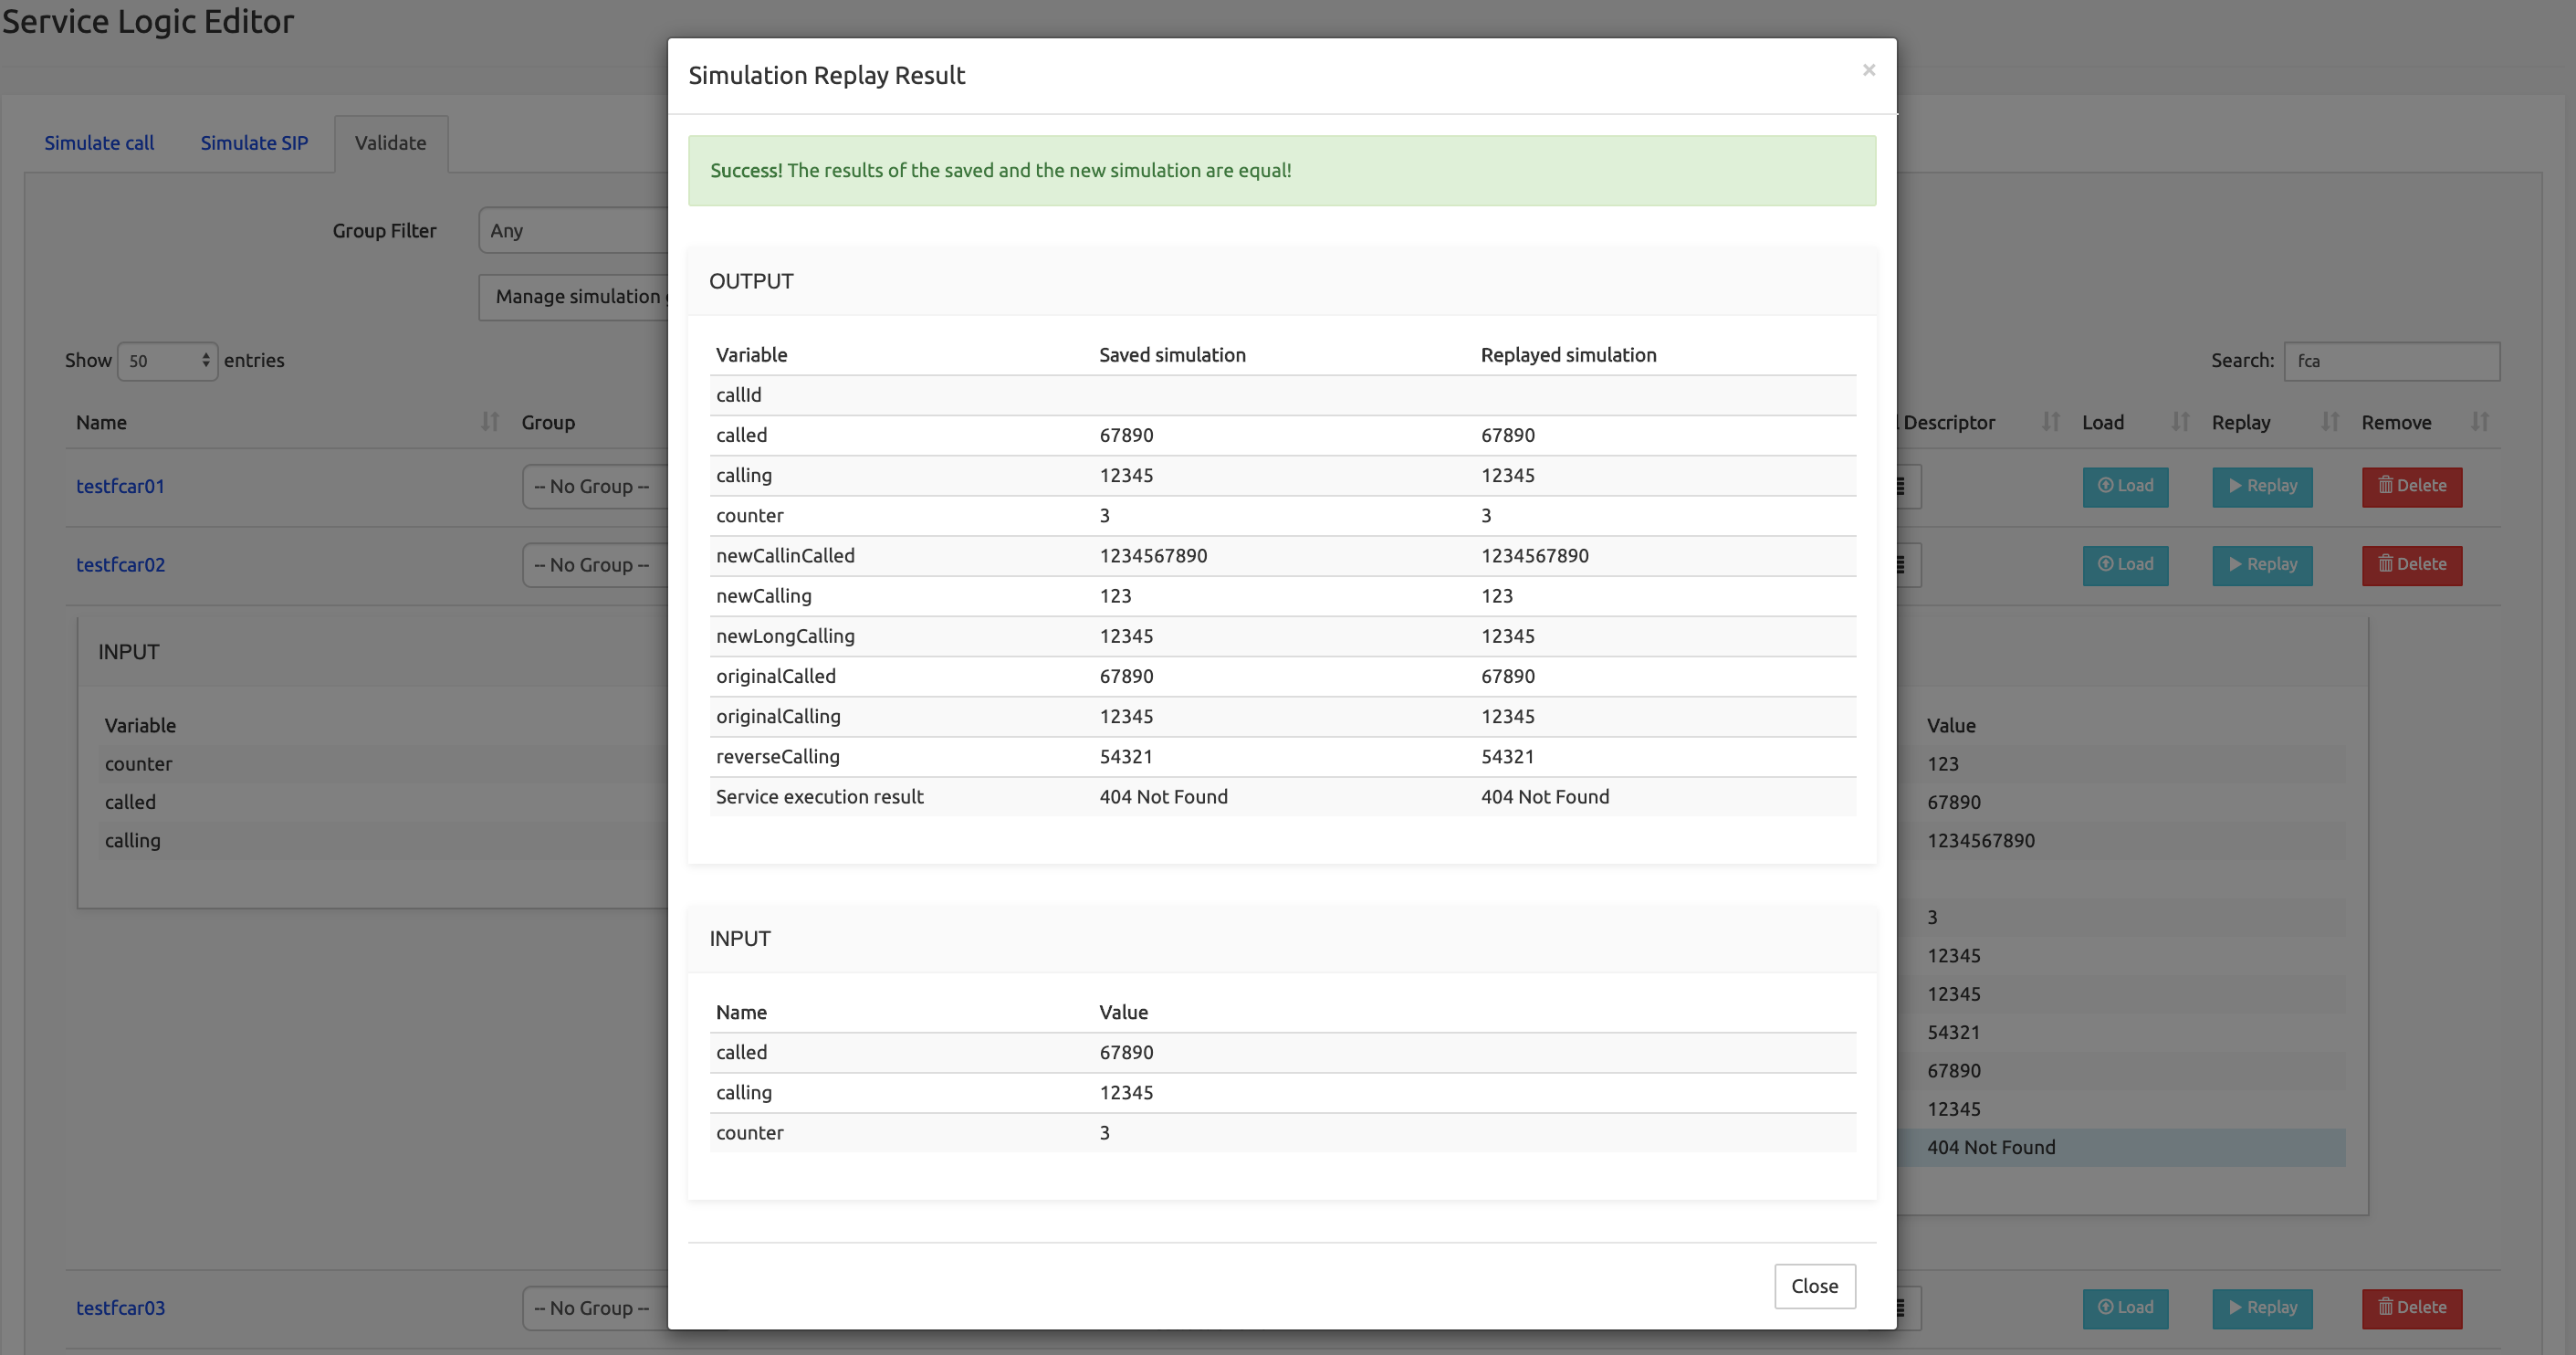
Replay button: replays the simulation and displays the comparison in a Simulation Replay Result modal window, showing the INPUT and OUTPUT list of variables and the values provided or processed by the saved simulation and the replayed one. Top banner (highlighted in green) indicates if the saved and replayed results are equal.
Delete button: deletes the saved simulation from the system (with Yes/No confirmation).
Grouping simulations and running them
At the top of the list of simulations, two elements allow managing groups of simulations.
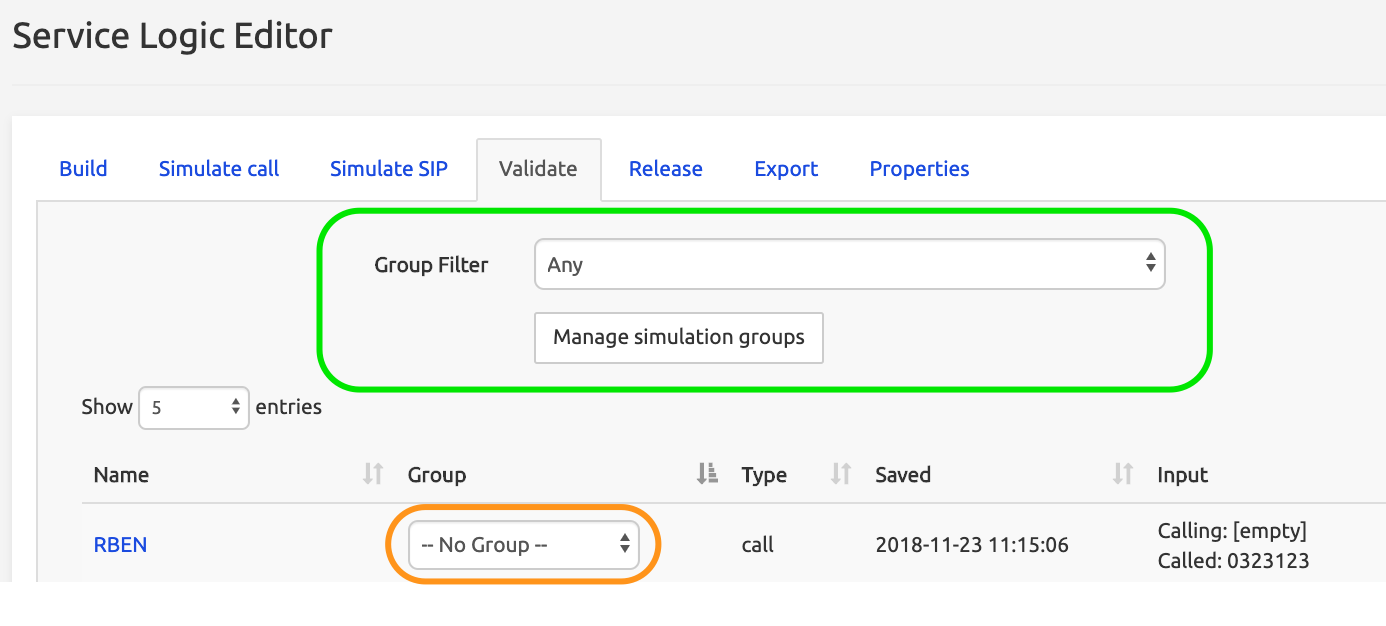
The Group Filter drop-down list shows the groups already defined and allows filtering the list below to show only the simulations belonging to this group. You associate a simulation with a group by selecting this group from the list in the Group column (circled in orange above).
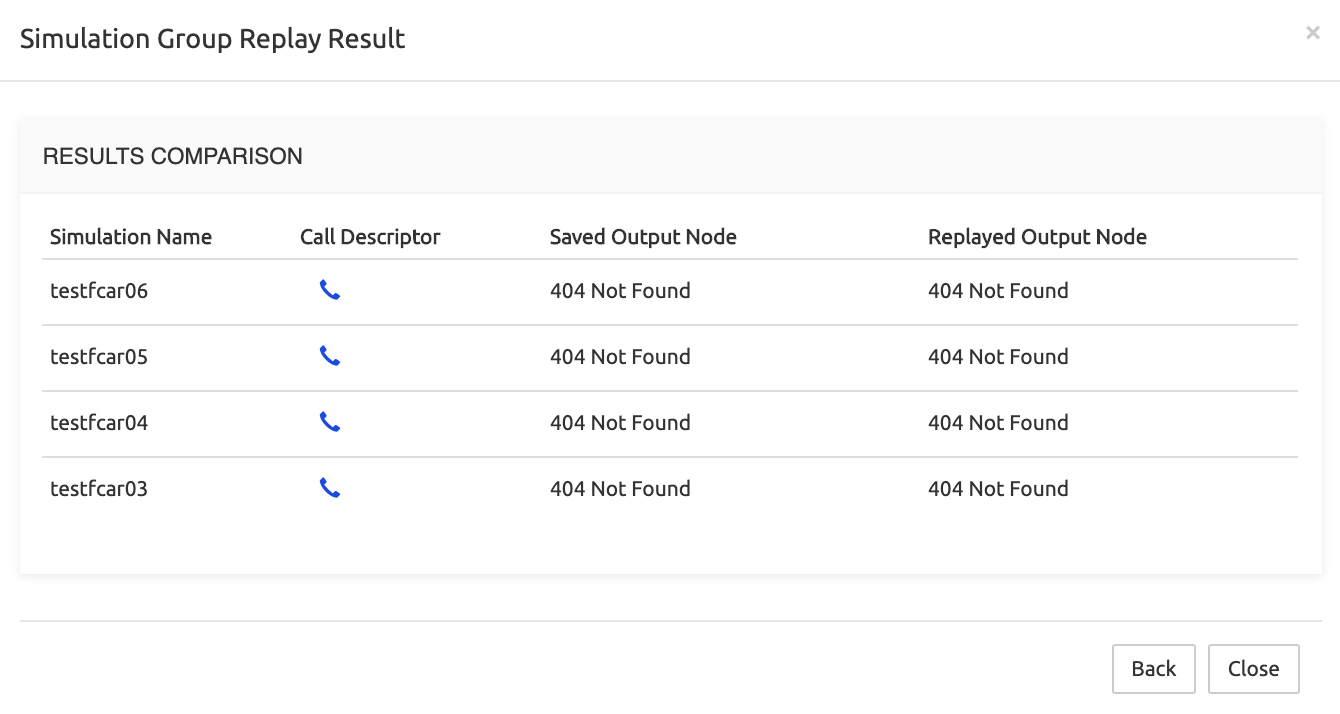
The Manage simulation groups button opens the modal window below:

From this window, you can:
replay a group of simulations (click Replay button: the results show in a modal window).
delete a simulations group (click Delete button - only the «label» is deleted, the simulations are not)
create a new simulations group (provide a name for the group and click Create button)
rename a simulation group (click its name in the Name column.
Exporting / importing simulations
Simulations can be exported from the active service logic to a file stored on a local system, or imported from such a file into the active service logic. This allows re-using simulations on a different deployment.
These operations are executed through the action buttons Export [...] and Import at the bottom left of the Validate / Simulations list, as shown below.
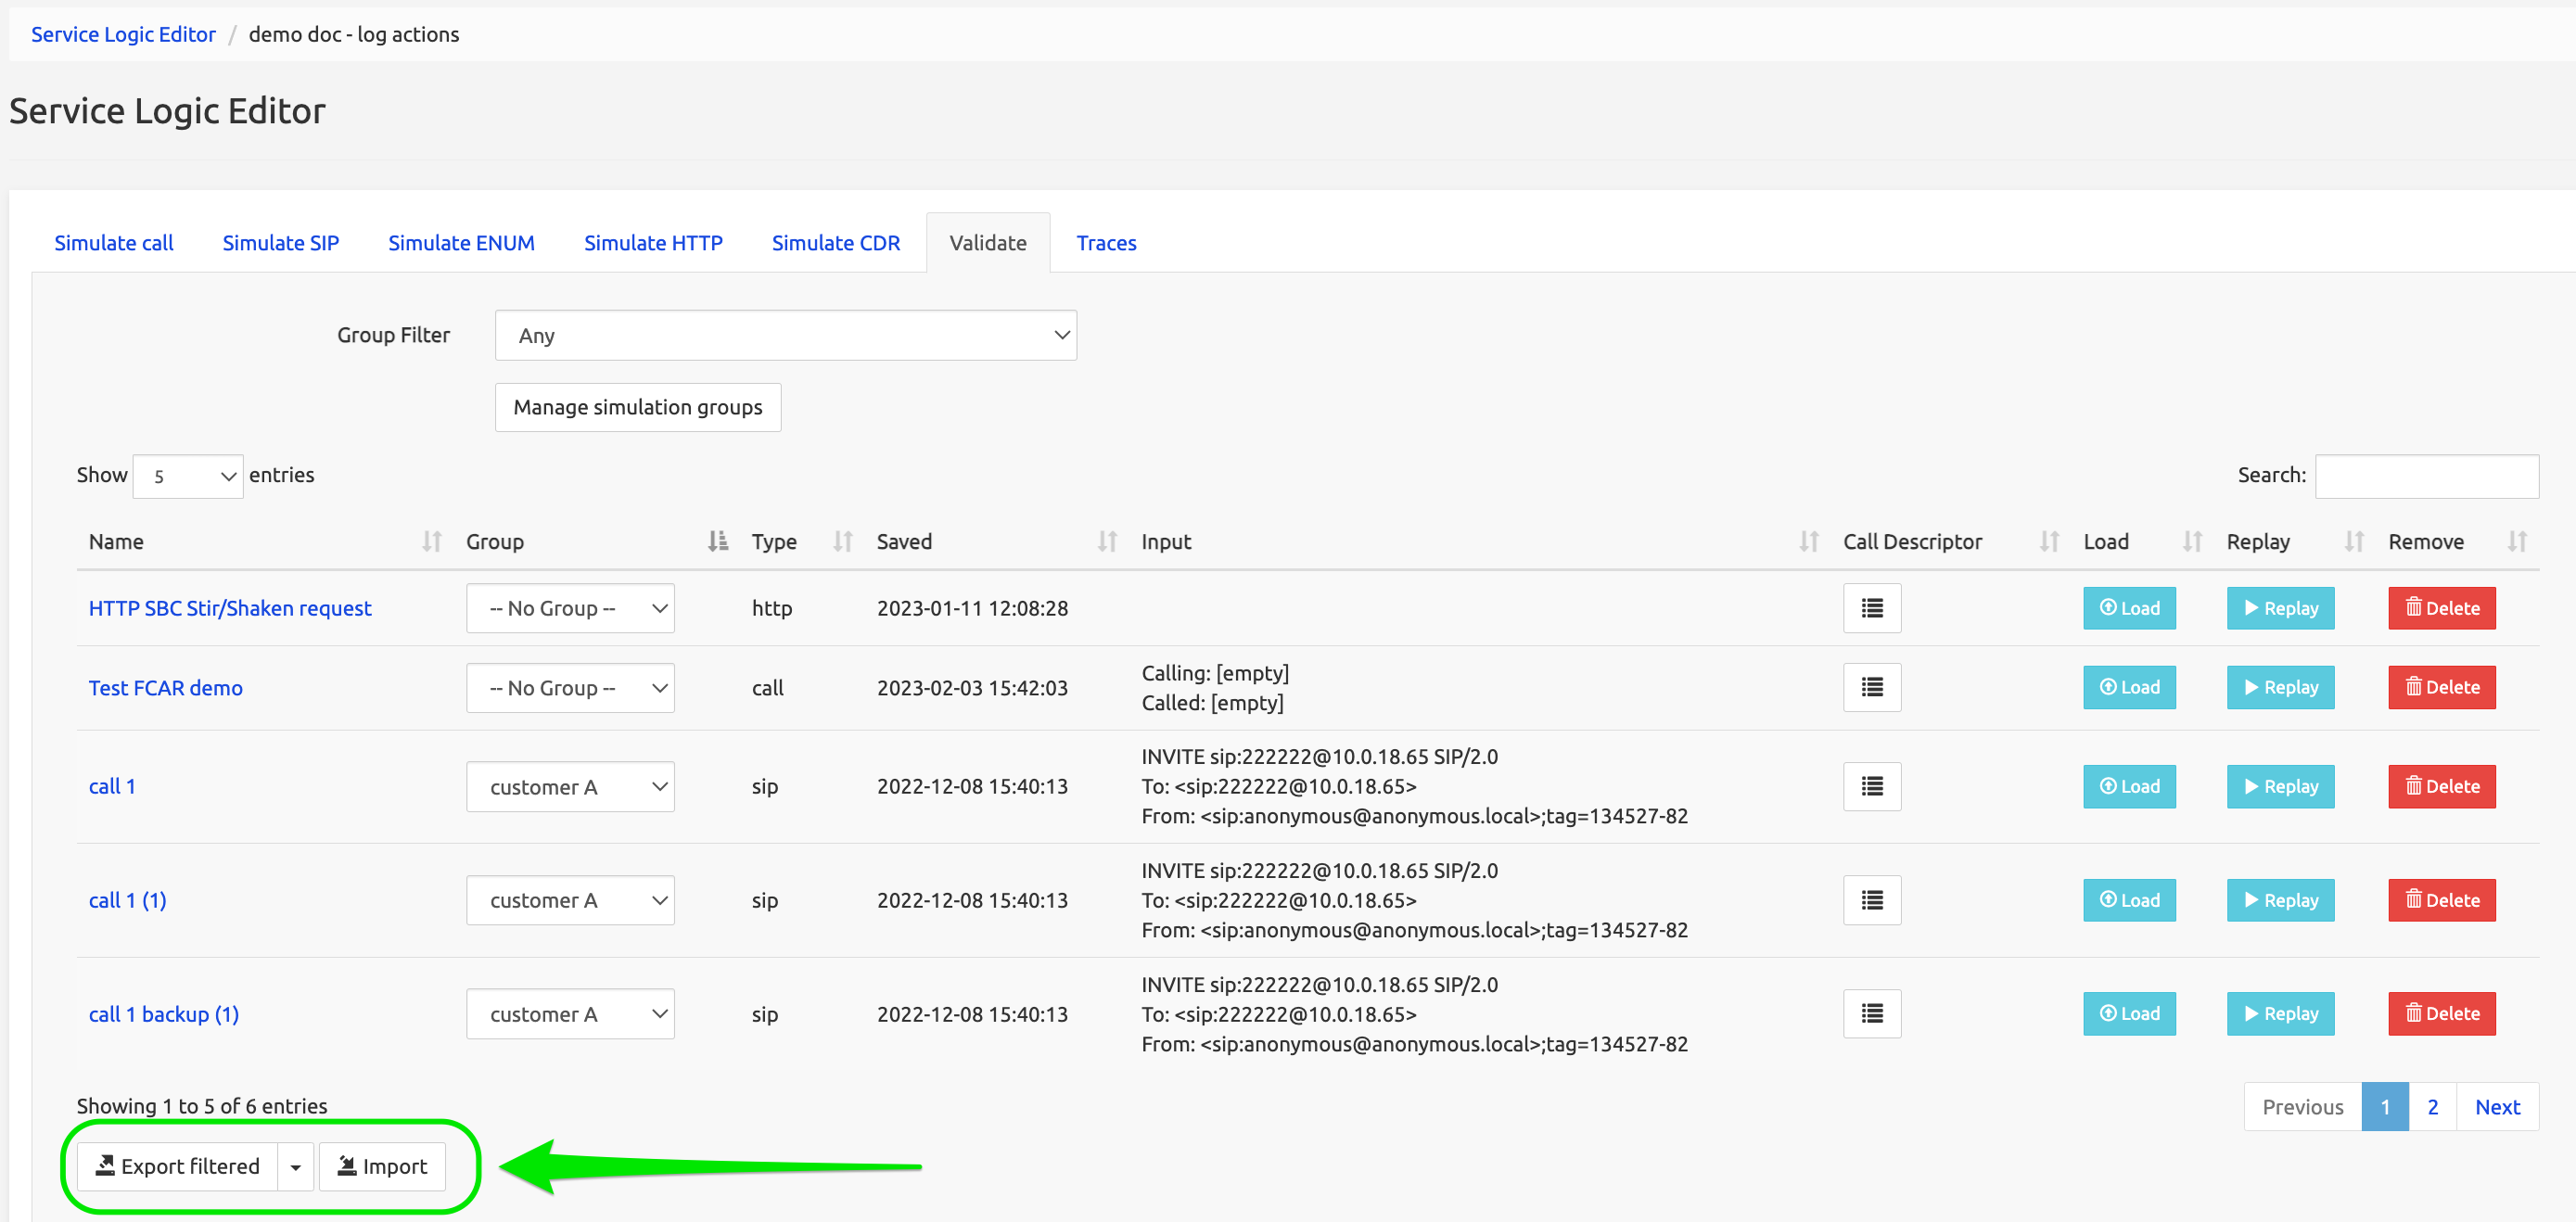
The list of simulations can be filtered using the Search field on the top right. The information just above the Export / Import buttons (bottom left) shows if the displayed list is filtered or not.
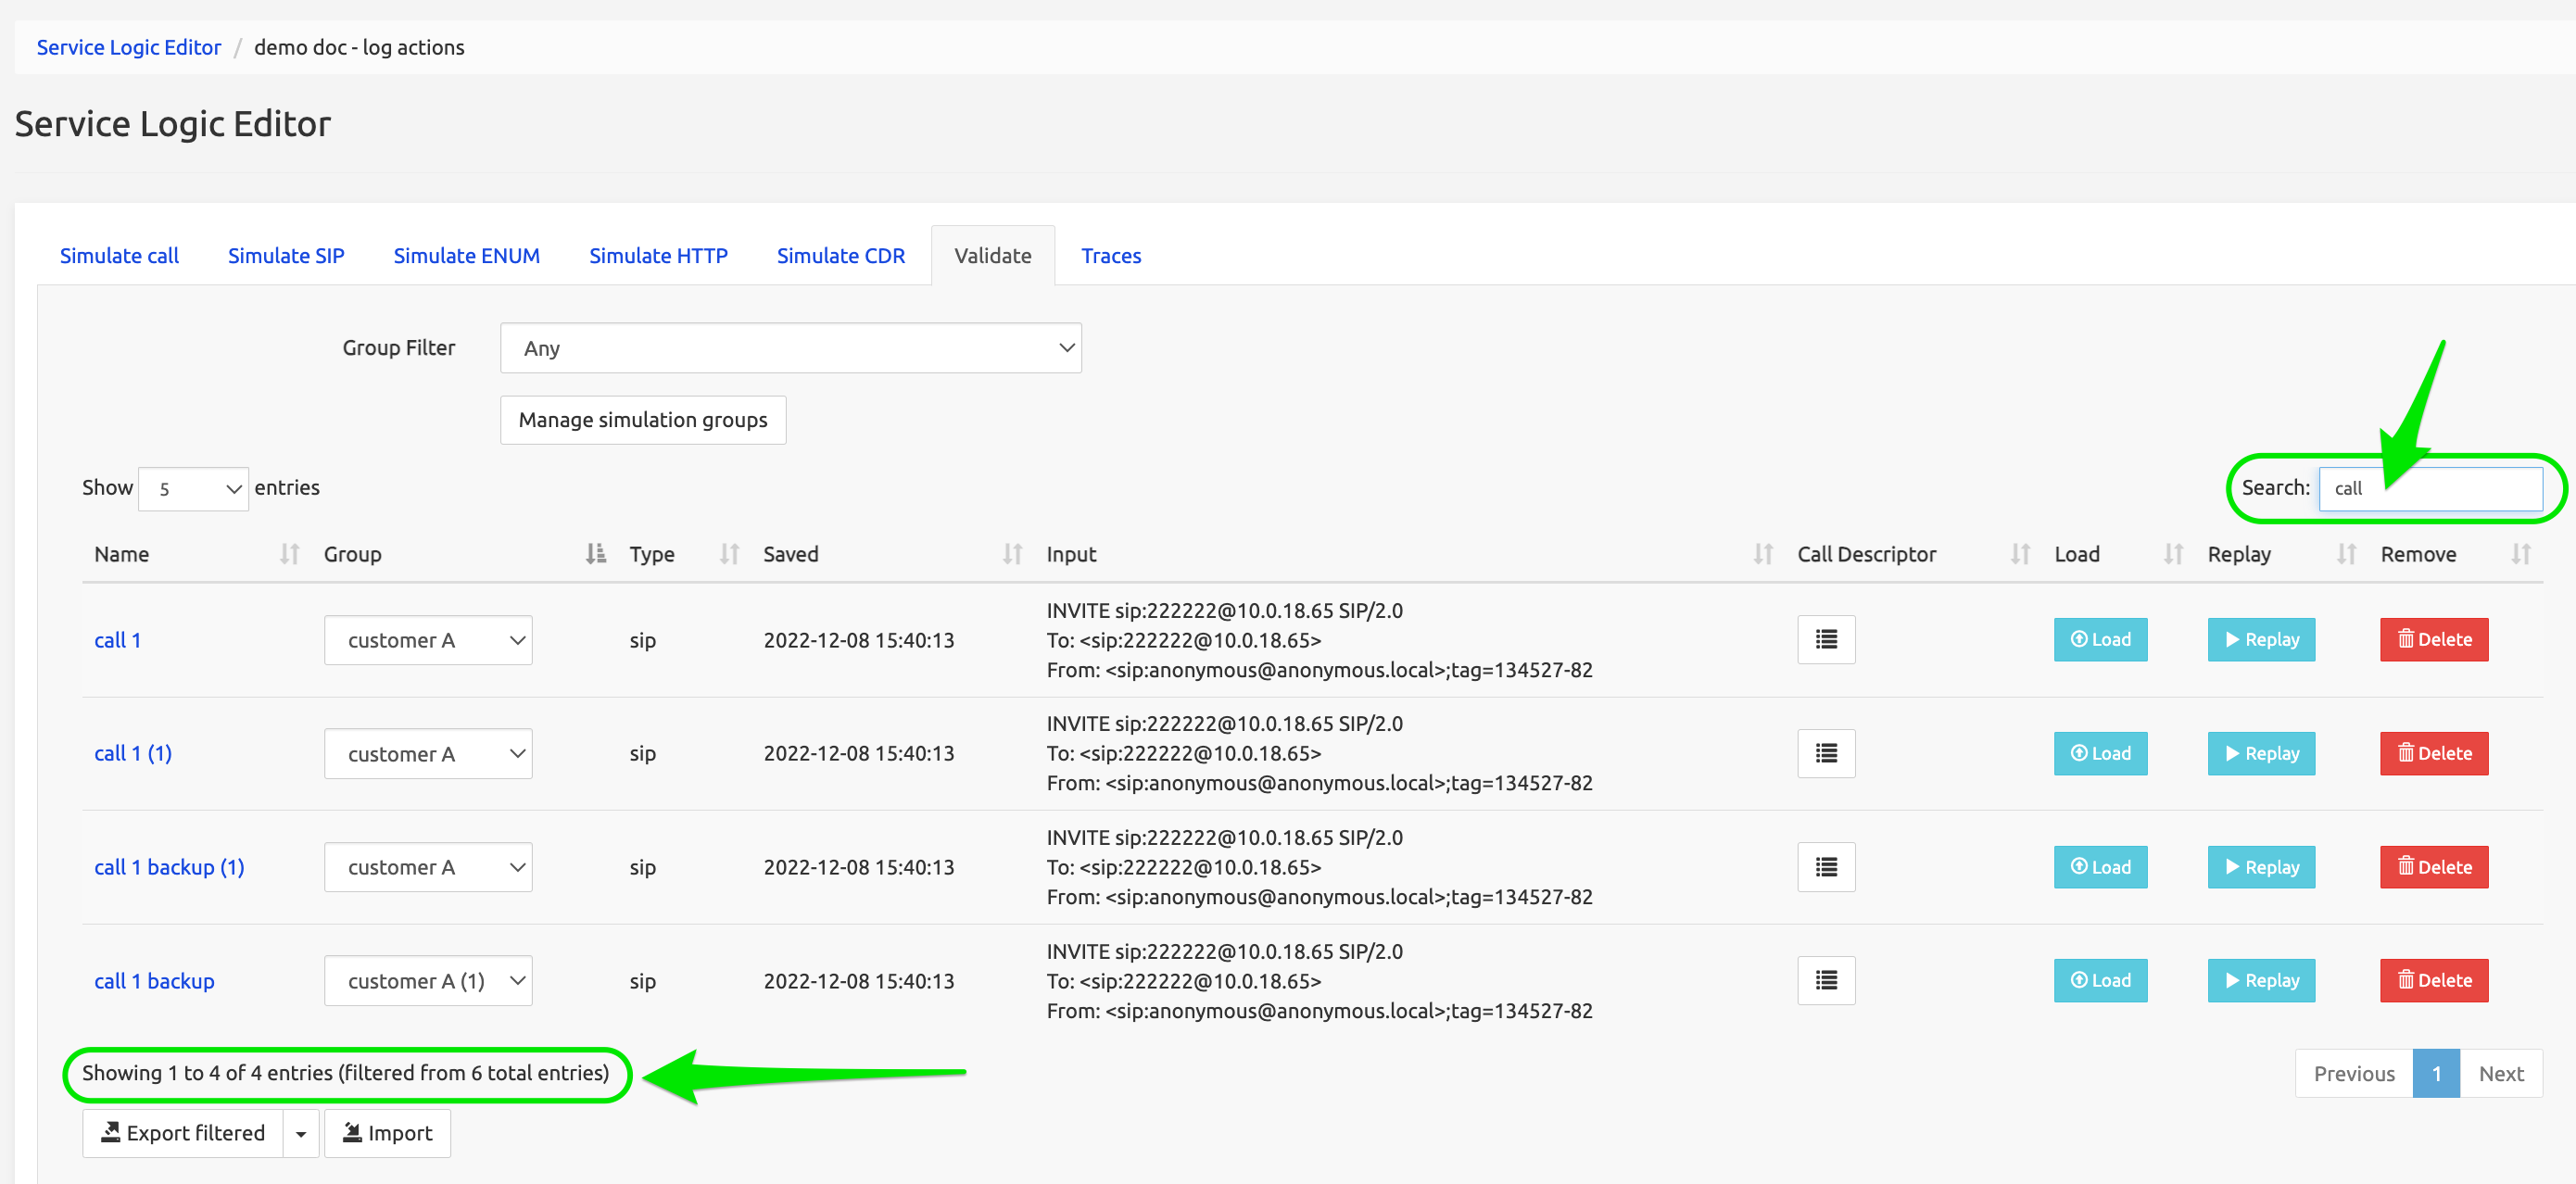
The Export button allows exporting:
a) the simulations in the filtered list. The button is labelled Export filtered. This will export the simulations in the filtered list to a file named simulations_filtered_<date-time stamp>.simulations. You can save this file anywhere on your local system (and possibly move it to another deployment).
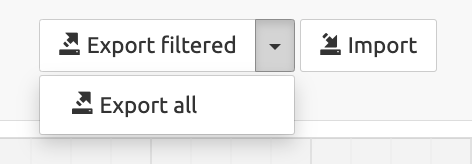
b) all the simulations in the (unfiltered) list. Use the drop-down arrow (see image below) and select Export all. This will export all the simulations, even if the list is currently filtered, to a file named simulations_<date-time stamp>.simulations. You can save this file anywhere on your local system (and possibly move it to another deployment).
To import simulations (usually coming from another deployment), click the Import button. This opens the Import Simulations sub-window, where you have to specify what you want to import.
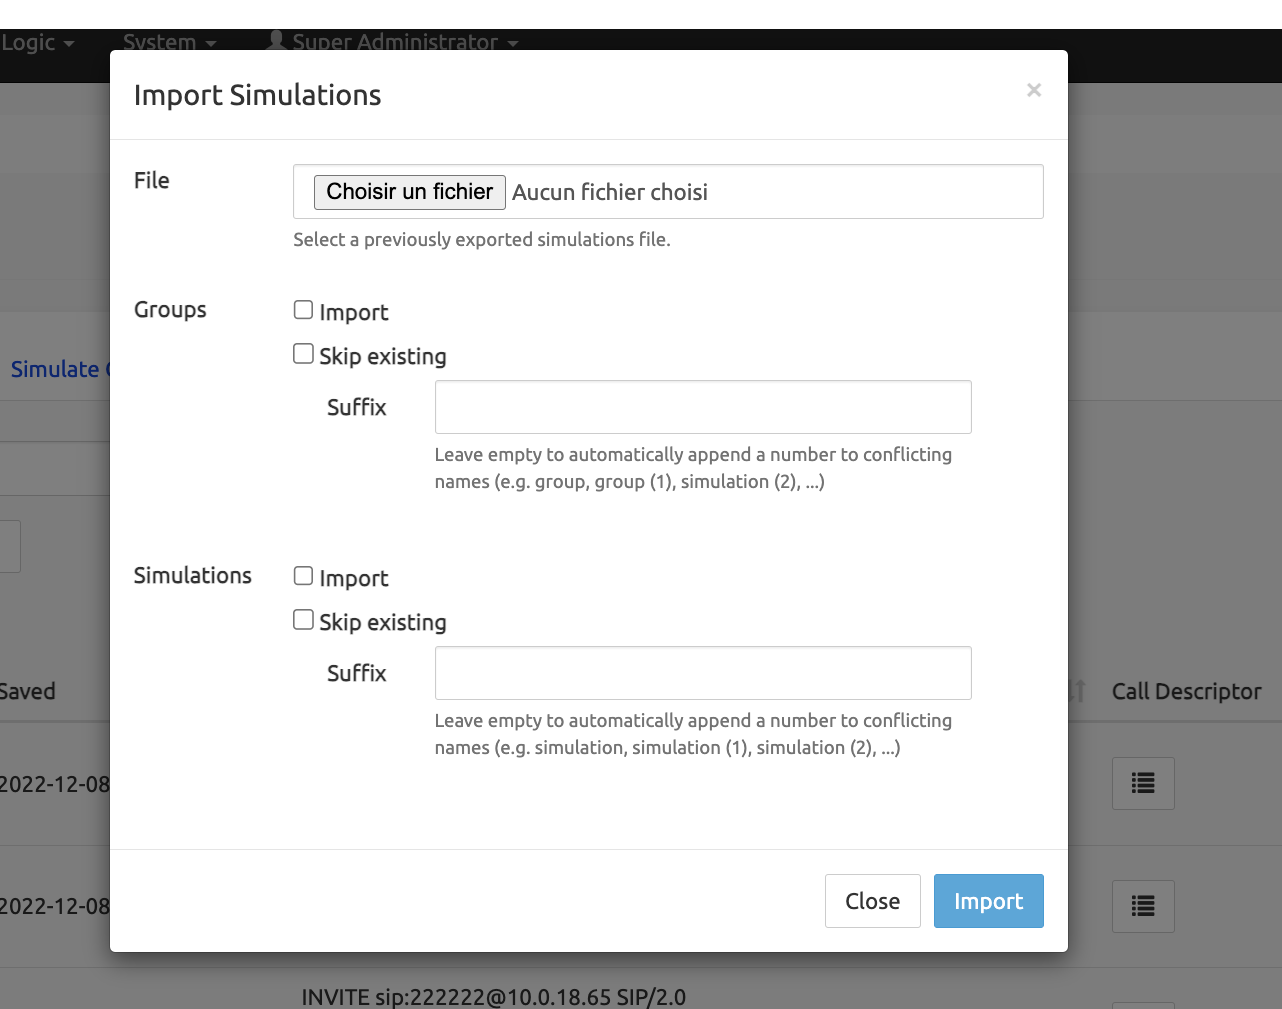
File: select on your local system a simulations file previously exported.
Groups
Import: check the box to confirm that you want to import the groups the simulations belong to. Leave blank to avoid group import.
INFO
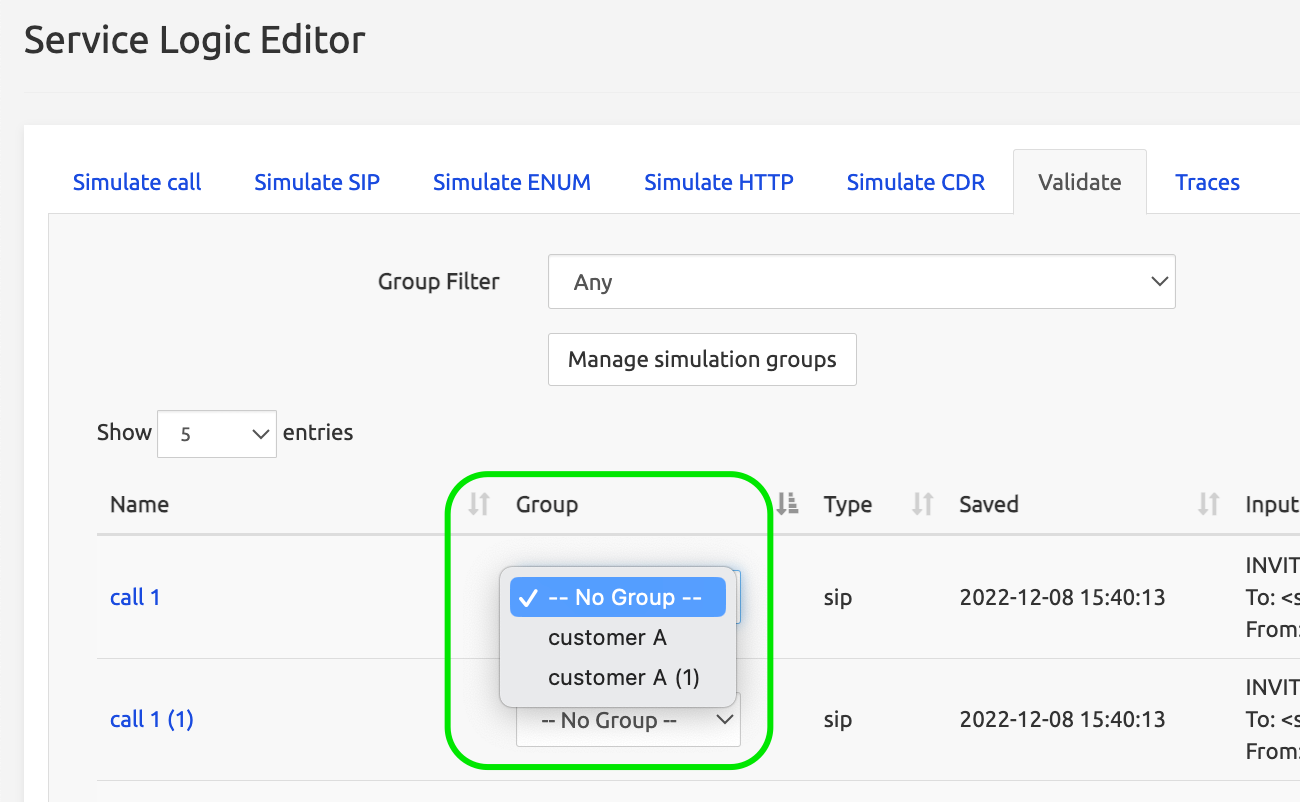
If groups are not imported [-- No Group --] for a simulation, they still can be associated manually in the top part of the Validate tab:
Skip existing: check the box to avoid overwriting a group name already existing.
Suffix: if left empty and there is a naming conflict between existing groups and imported groups, the imported groups are suffixed (1), (2), etc. To use a different suffix, simply type it.
Simulations
Import: check the box to confirm that you want to import the simulations (this is actually what you are expected to want if you are here).
Skip existing: check the box to avoid overwriting simulations already existing.
Suffix: if left empty and there is a naming conflict between existing simulations and imported simulations, the imported simulations are suffixed (1), (2), etc. To use a different suffix, simply type it.
When all your selections are set, you can use the Close button to cancel the operation or the Import button to execute it.
Traces tab
The content of the Traces tab is defined in the System > Tracing setting.
INFO
If no criteria are defined in System / Tracing tab, the Traces tab will remain empty.
At least one real or simulated SIP call or one HTTP/ENUM trigger must match the criteria in System / Tracing for any trace to appear in the Traces tab.
When a SIP/ENUM/HTTP transaction matches the criteria defined in the Tracing tab, a new trace appears in the Traces tab of the corresponding active Service logic for SIP/ENUM/HTTP.
The number of traces visible here is limited by the setting in System > Settings > GUI > Max number of traces stored in-memory.
Once a Trace is available, the user can click on Call Descriptor or Show:
Call Descriptor: it shows the call descriptor for the traced call, with particular attention to the outcome Service Execution result (it could be e.g. relay to... or redirect to ... )
Show: it replays the call into the Simulation tab of the Service Logic, provides a graphical view of the traversed nodes and the full Simulation tab at the bottom of the page.
Traces are automatically rotated by the system when they reach the max number of traces stored in memory.

The Traces list receives live updates as new calls come in, and you can halt the real-time updates by clicking the pause/play button located in the top left corner.
Release tab
Releasing a service logic consists in creating a frozen, not editable version of it, normally for use in production.
To release a service logic, provide a name and description for the released version and click Create Release button. The released service logic is created and can be accessed in the Releases tab of the Service Logic List page (see above Development vs Releases).
INFO
When a new release is created, a tag with the name of the release is automatically added to the service logic and related sub-service logic.
Released service logic cannot be modified (edited) but it can be instantiated, i.e. a new editable service logic will be created from the released one and will become available for edition in the Development tab of the Service Logic List page.
To instantiate a released service logic, click the Instantiate button on the desired line in the Releases tab of the Service Logic List page, provide a name for it and go find it in the Development tab of the same page.
Export tab
The Export tab presents an Export button which saves the service logic being edited into a local <name-of-service-logic>.slid file for import into another SRE system (see Import button in Service Logic List).
Properties tab
The Properties tab displays a form allowing to modify the current Name and Description and tags of the service logic being edited.

Changelog tab
The Changelog tab allows showing the changes of the current service logic (development version or released) versus a previous release. Upon choosing a target release for comparison and clicking the Compare button, a comprehensive list of all modifications is displayed below.
Clicking on the link for changed nodes opens the respective panel.

Selecting service logics for operations
From the main menu bar, select Service Logic to open the menu, then Service Selection to open the Service Selection page.

Service Selection
When opened, the page displays the Service Selection form, with the first link in the left panel active (Service Logic Selection, blue background). The form lists the interfaces configured on the system and allows selecting the version of the service logic that will be active for each interface.
Custom endpoints created for SIP or HTTP interfaces in the third tab on the left (see below Custom Endpoints for SIP and HTTP) appear in this list, as well as default endpoints.
The drop-down lists in the Active Version column display all the service logics available on the system and allow selecting one of them. The indication between brackets after the service logic name shows its version type: (development) or (release name and version).
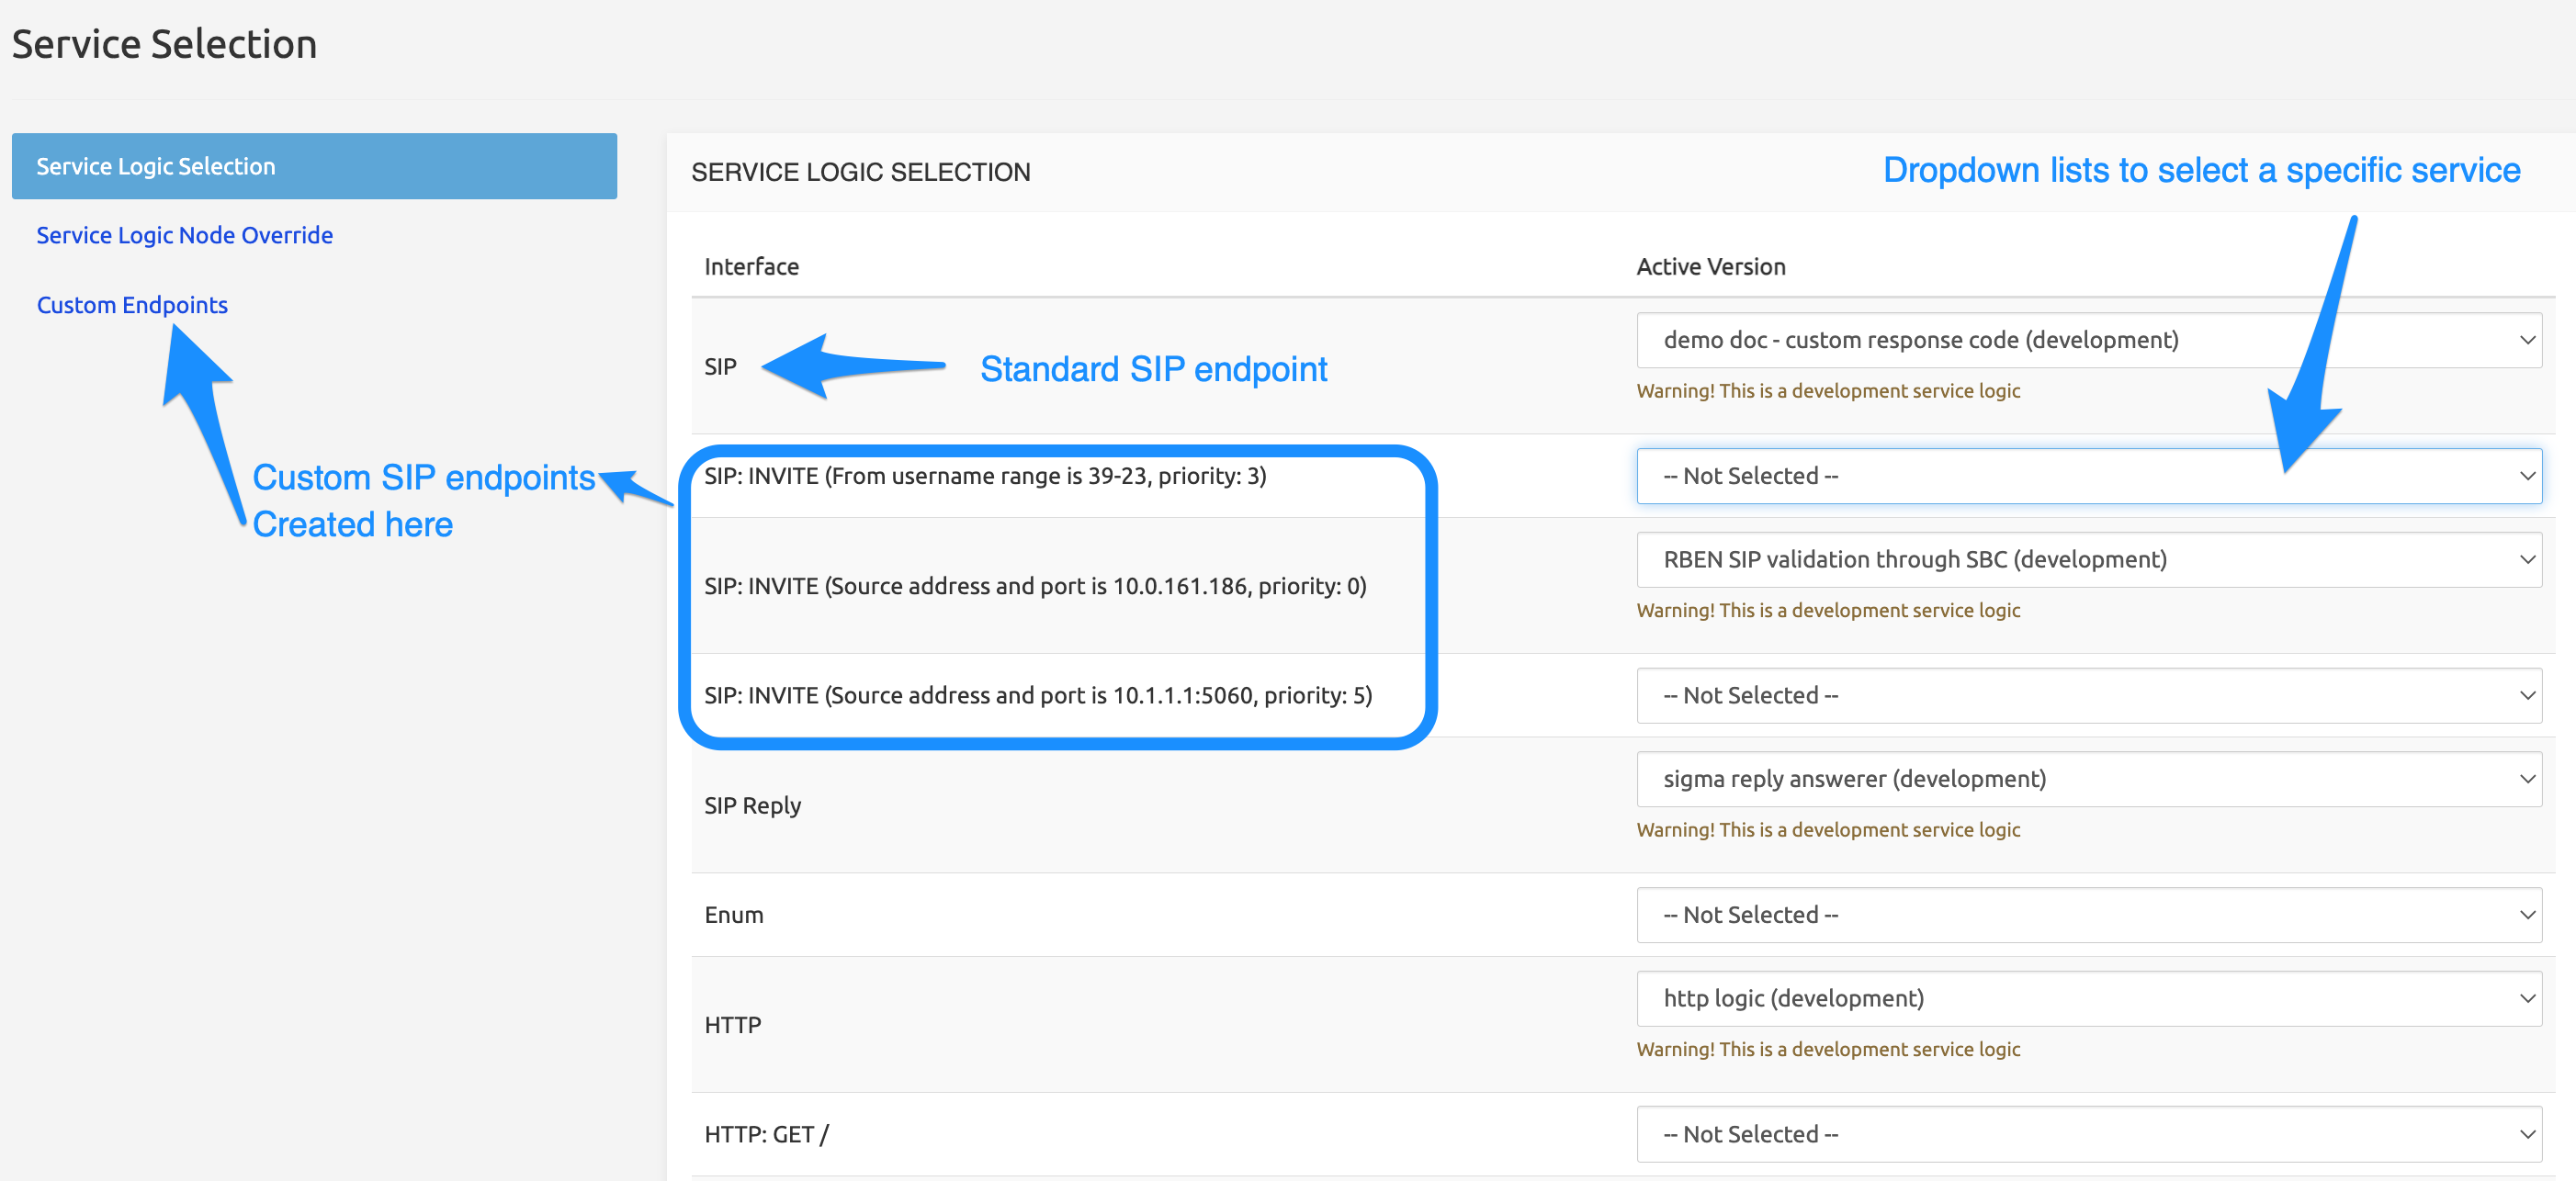
Select the Active Version appropriate for each interface, then click Save button when done.
On the right side of the drop-down list, there is an action button containing Open and Edit links that allow you to view or edit the currently selected service logic.
Probing SIP peers: Custom Agents Probing
SRE 3.2 brings in an alternative way of probing SIP peers in SRE, still using SIP OPTIONS as in the original feature, but expanding the possibilities to customize the SIP message headers and parameters.
Within the section Service Logic > Service Selection > Service Logic Selection, the user can now select a specific SL for Custom Agents probing.
This logic has to be designed in a similar way as any other Service Logic.
The principle is to create an array of records (record list) containing:
the name of the sip peer
the IP address
the port (default 5060)
the transport (default UDP)
the Request-Uri (default <remoteIP>:<remotePort>)
the From URI (default sip:ping@<localIP>)
the To URI (default sip:ping@<remoteIP>)
CDR Post-processing
CDR Post-processing allows the user to build brand-new tailored CDRs, starting from SRE default CDRs. The default CDR fields are passed to the selected Service Logic for CDR Post-Processing in the form of variables of a call descriptor. The purpose of such Service Logic is to create an Output CDR row, which contains the selected fields (Columns).
The post-processed CDRs are then stored in the directory configured in System > Settings > Accounting > SIP accounting post-processing output directory (default dir: /data/sre/accounting/postprocessing/ ) for further use.
Service Logic Node Override
The second link in the left part, Service Logic Node Override, displays the form below. It lists again the interfaces configured on the system, together with the Call Processing nodes, for each interface a selection list allowing to pick for each node a service logic different from the default one (the one selected in the Service Logic Selection form described above).
If applicable, select an Active Version different from the default one for a particular interface on one of the Call Processing nodes. Click Save button when done.

These settings complete the setup of the service logic selection for the SRE to operate in production conditions.
Custom Endpoints for SIP, HTTP and scheduled Service Logic
The third link in the left part, Custom Endpoints, allows for defining custom endpoints for SIP (specific SIP messages based on the SIP Method (INVITE, REGISTER, UPDATE, NOTIFY, ...) or HTTP (specific URLs), to which a specific Service Logic can be set (see above the Service Logic Selection tab). This is a powerful way to trigger different behaviors for different methods (for example, HTTP method GET as opposed to PUT as opposed to POST) or even for the same method and different URLs. It's also possible to add a custom endpoint to periodically trigger a specific service logic.
The Custom Endpoints list allows the creation of new custom endpoints, lists the endpoints already defined and allows removing them.
For SIP endpoints:
Match type: dropdown list to select the type: source/destination address and port, From or R-URI range, Regexp
Match value: the value to consider for the selected type
Priority: in the case of multi-match, the highest priority wins.
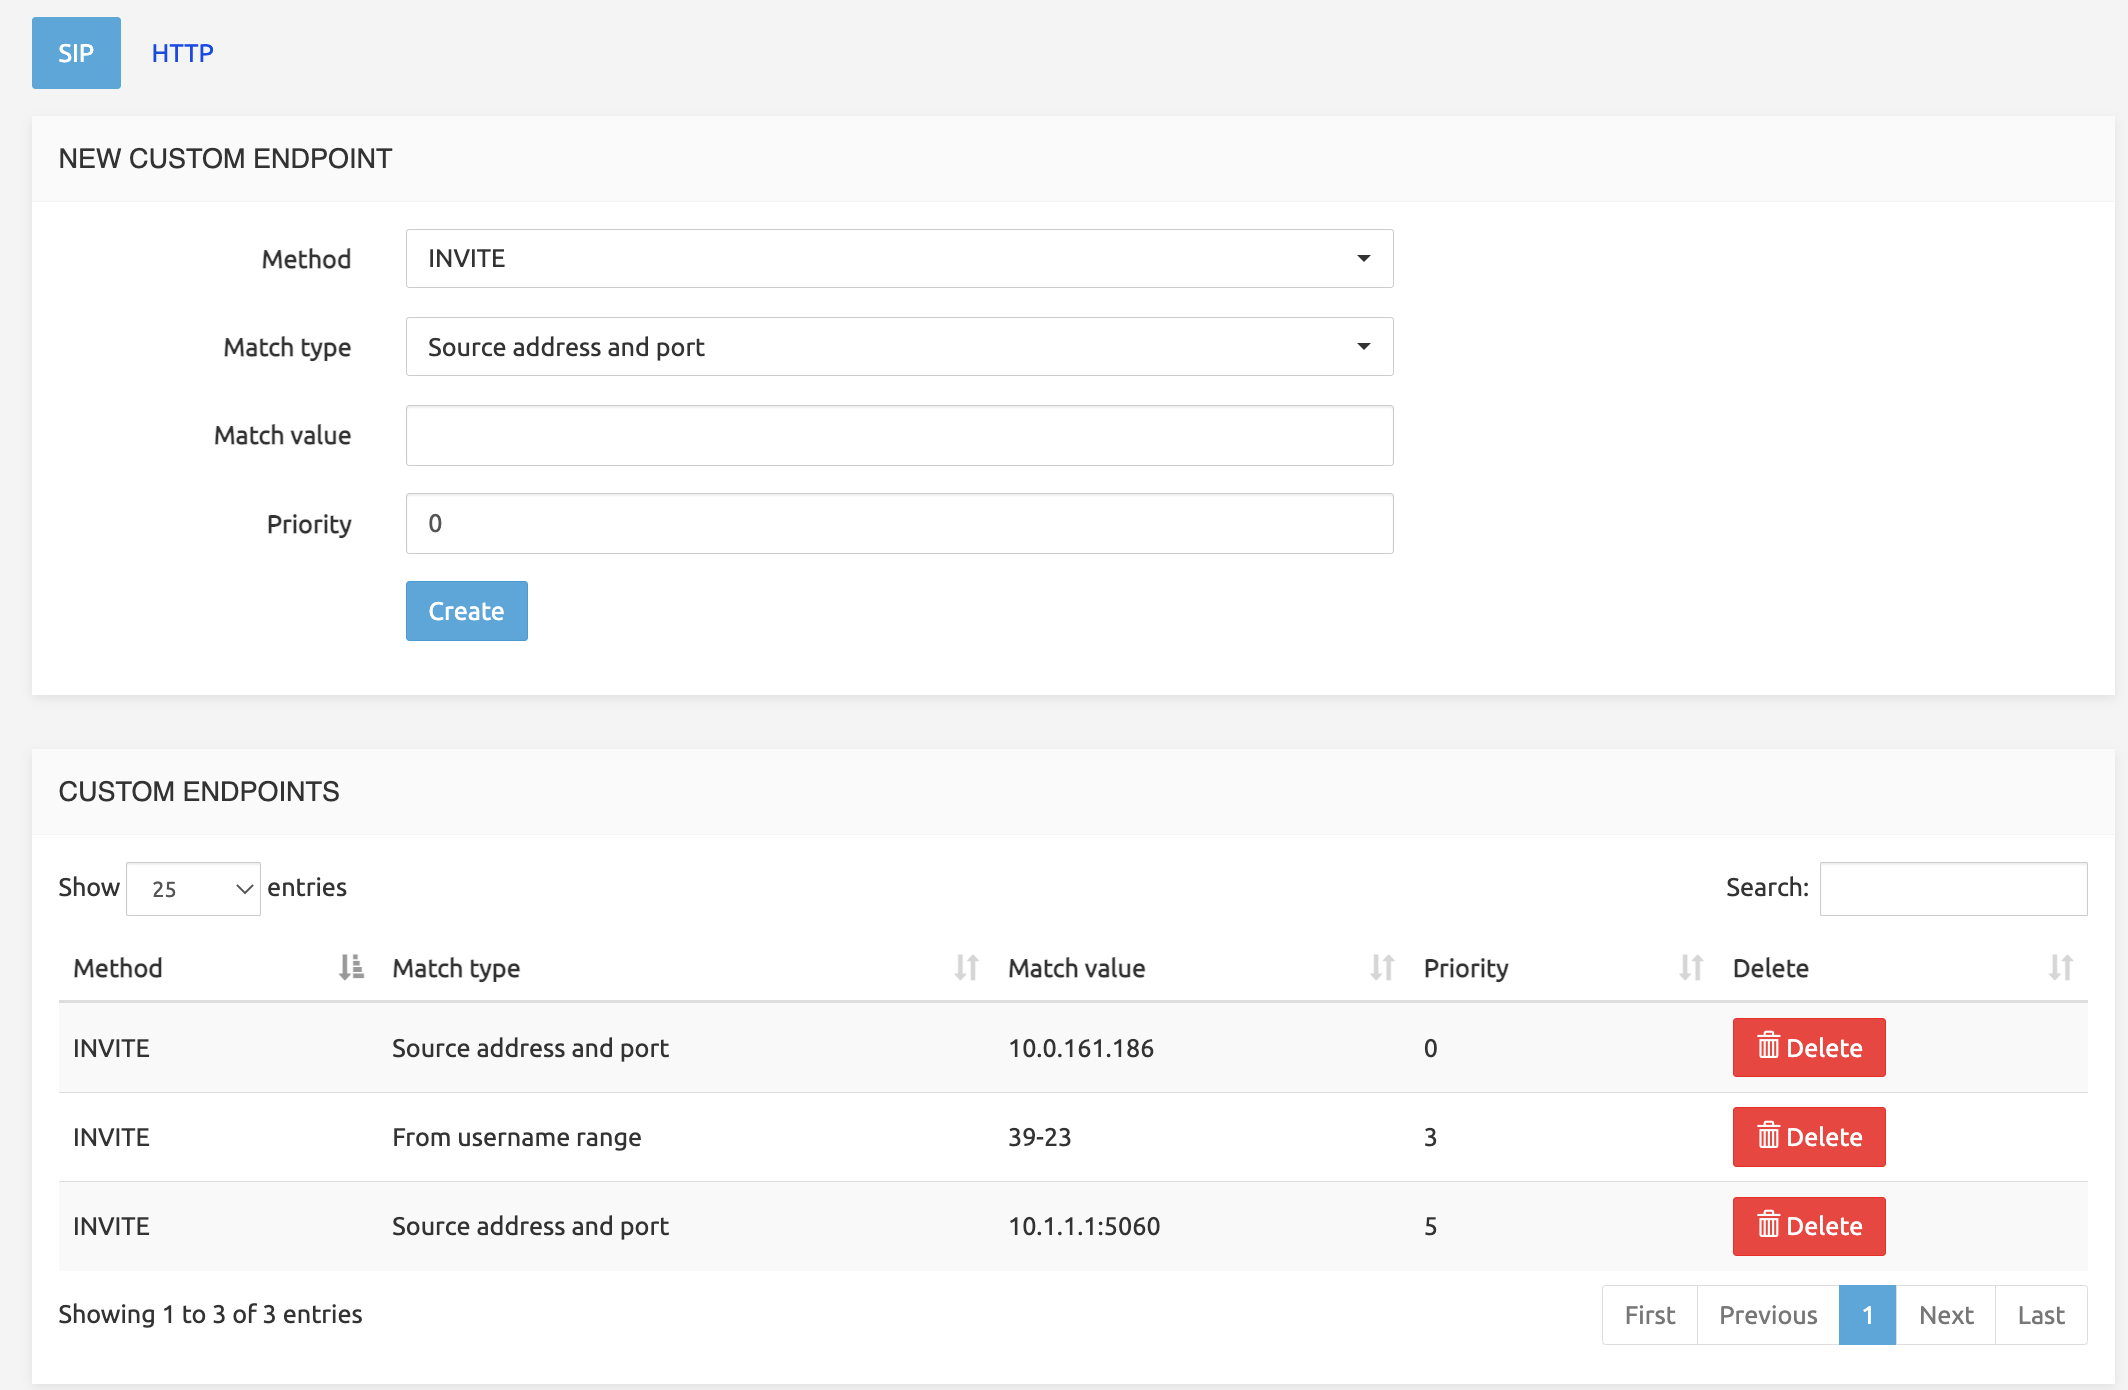
For HTTP endpoints:
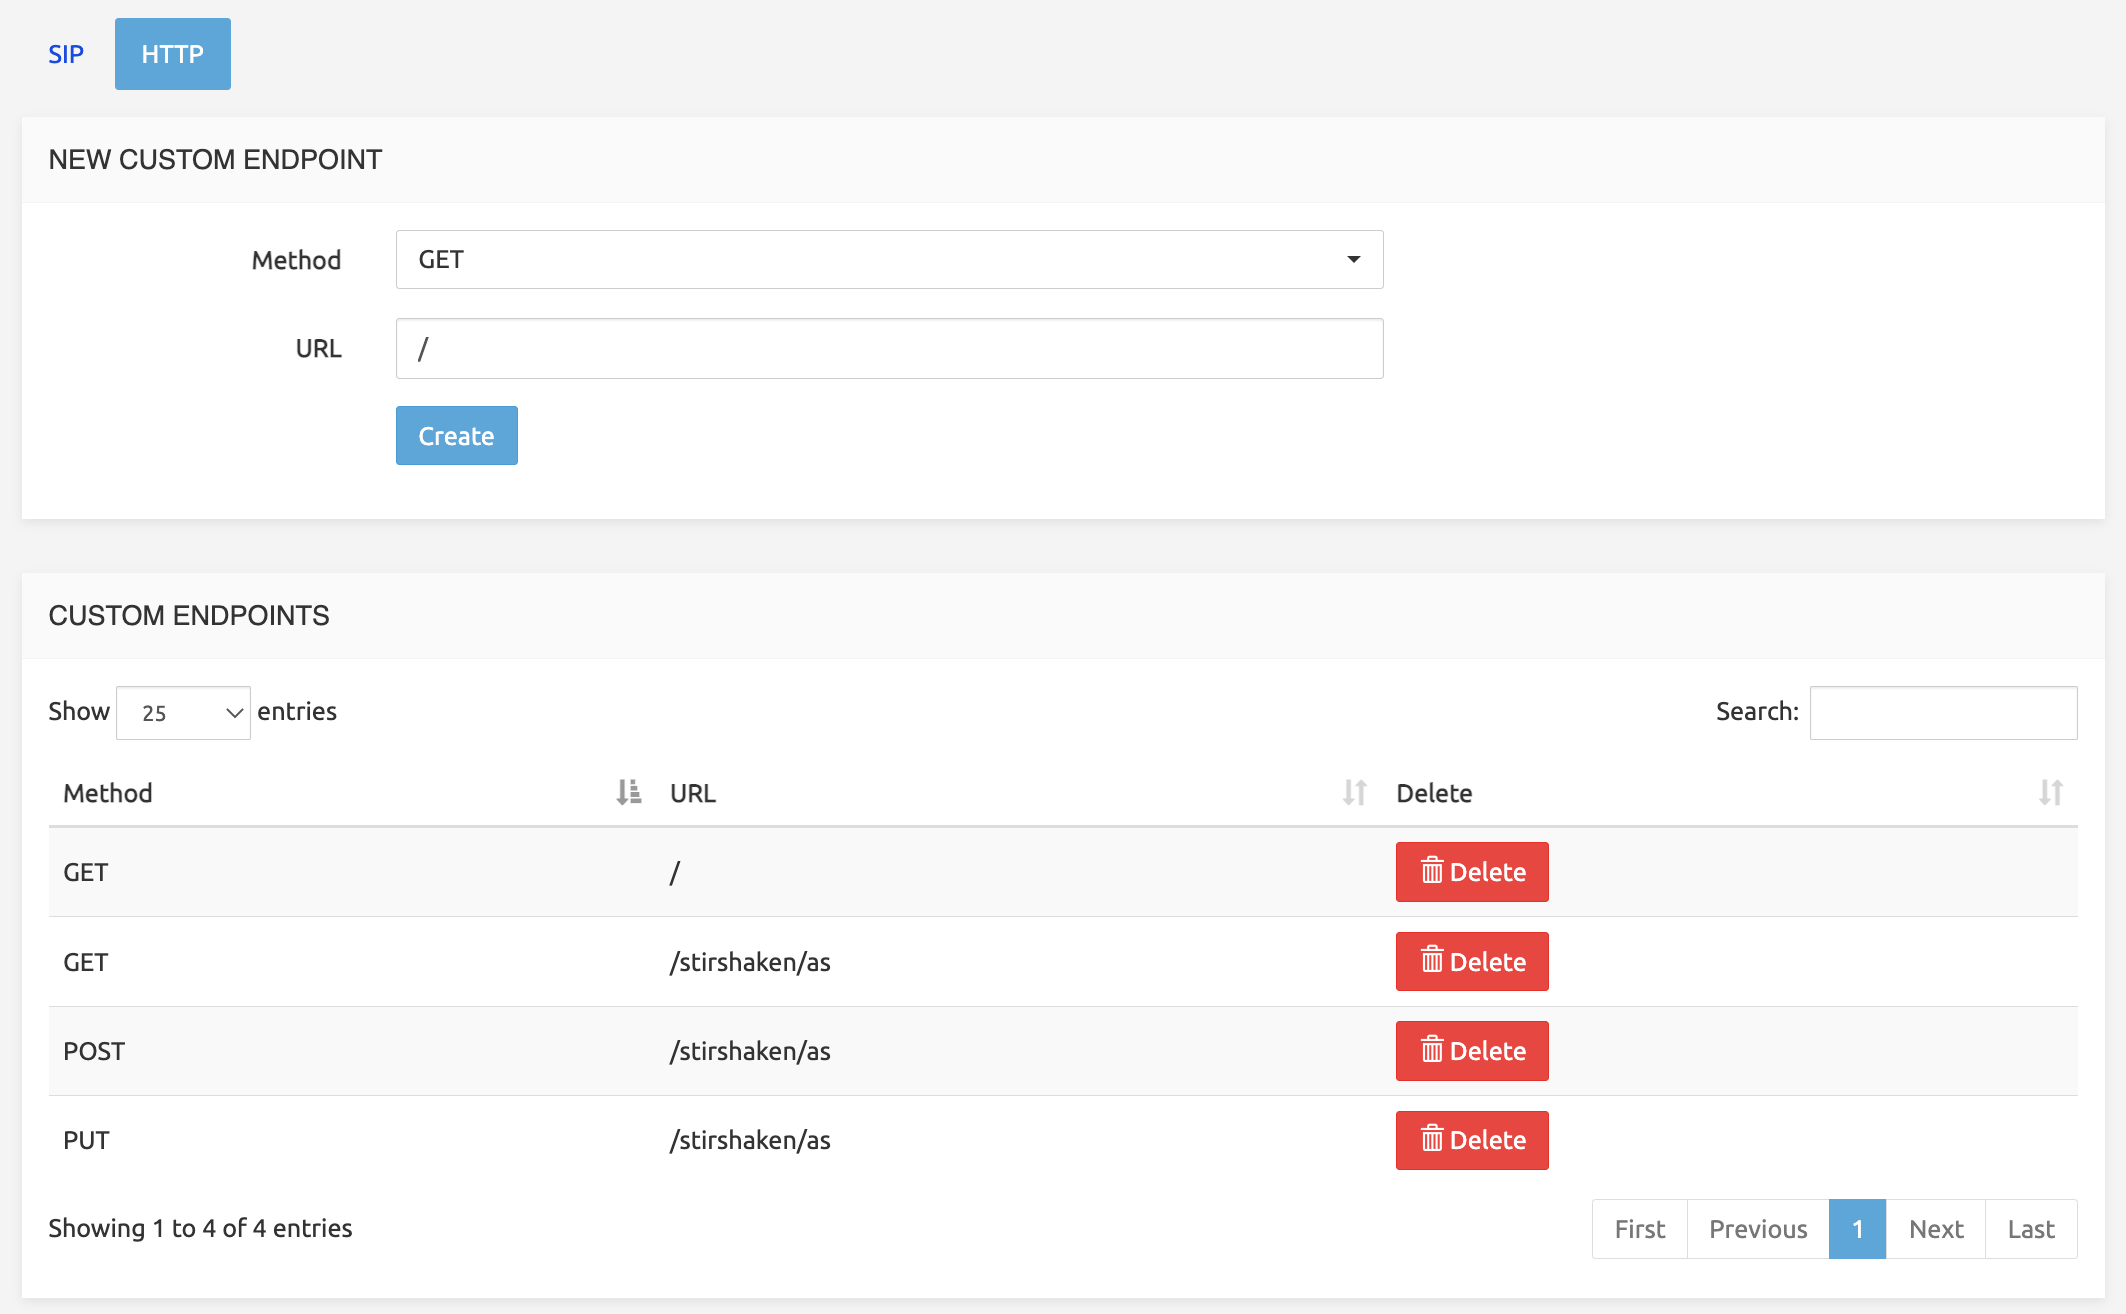
Based on the matching of these criteria, a specific SL execution will be launched, according to Service Selection (with a dropdown list for each endpoint created here, see Service Selection above).
For Scheduled endpoints:
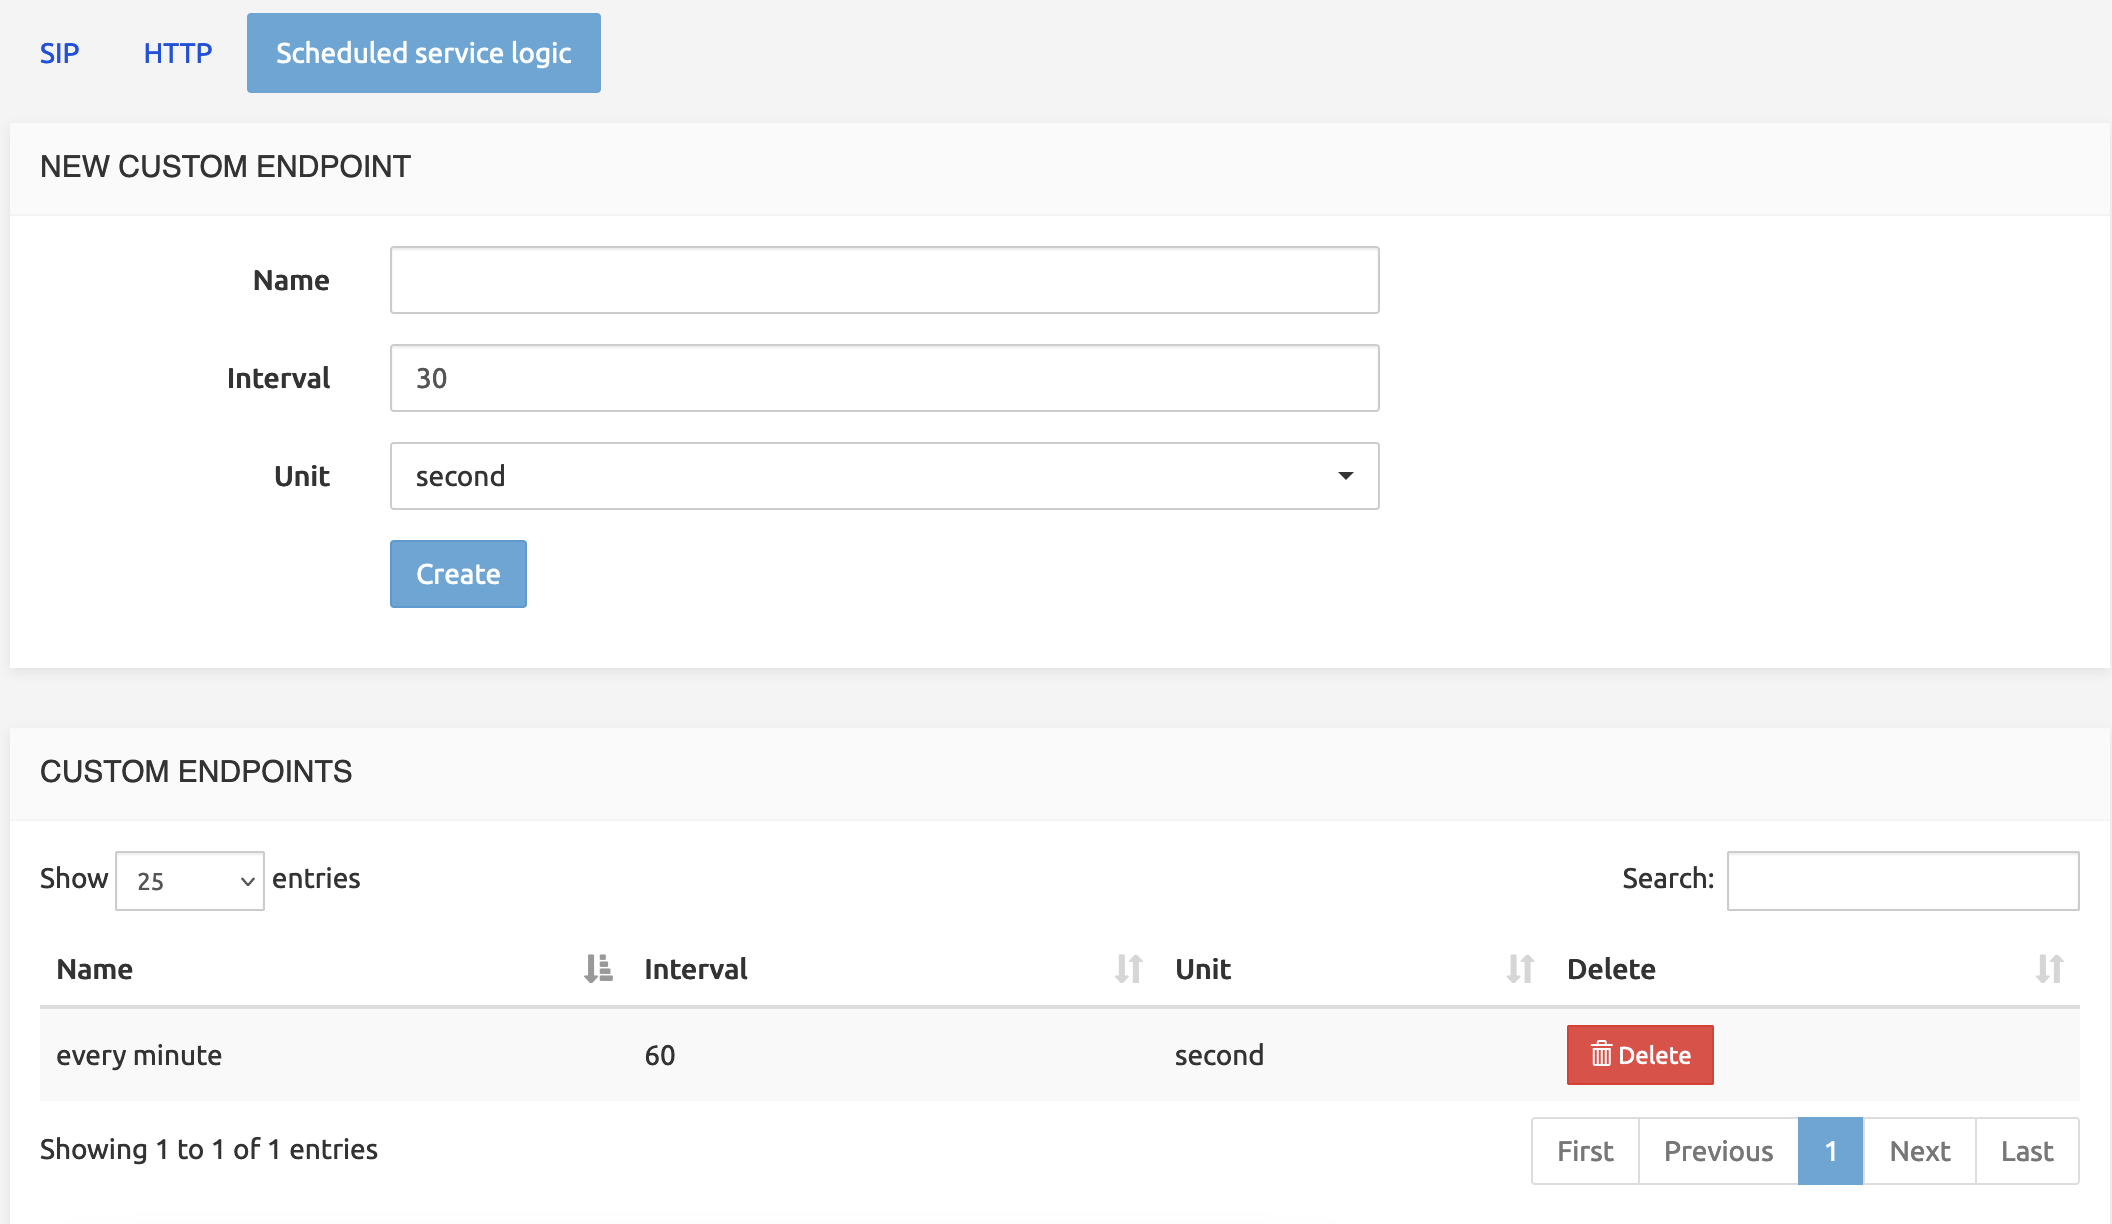
Based on the selected interval and unit of time, a specific SL execution will be launched, according to Service Selection (with a dropdown list for each endpoint created here, see Service Selection above).
The service logic can access the following predefined variables:
- now: the current system time and date
- hostname: the current hostname running the service logic
