Introduction
The Alarm Guide describes the available alarms in version 4.1 of SRE, along with their description, monitored operations, SNMP configuration and MIBS description.
Alarming Dashboard
Alarms are presented to SRE administrators in two places: notifications in the main SRE banner and the Alarms page accessible through System > Alarms.
The SRE raises alarms when thresholds are reached for the operations listed in this document. As soon as the situation is back to normal, the system automatically clears the corresponding alarm (see Clearance below). Manual clearance is possible, but it does not fix the situation that has caused the alarm: if a node or a SIP Agent is down or if a process is stopped, manually clearing the alarm will not restore connections or restart processes.
Alarm notification
Alarm notifications appear in the four squares on the right in the main SRE banner, one square for each severity from info to critical.
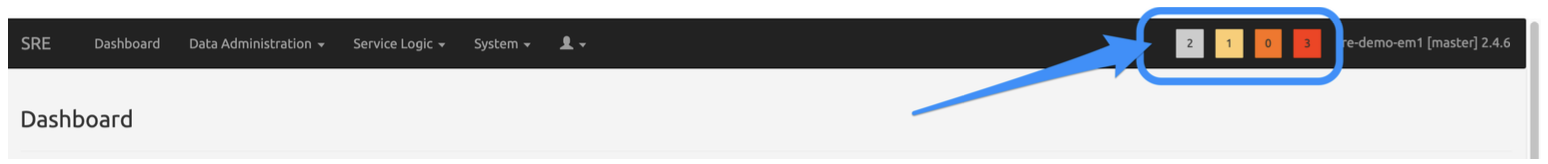
Only active alarms are counted in the number displayed. Clicking on any square opens the Alarms page with the appropriate filters: alarm status is « Active », alarm severity is any of the four severities depending on the square clicked.
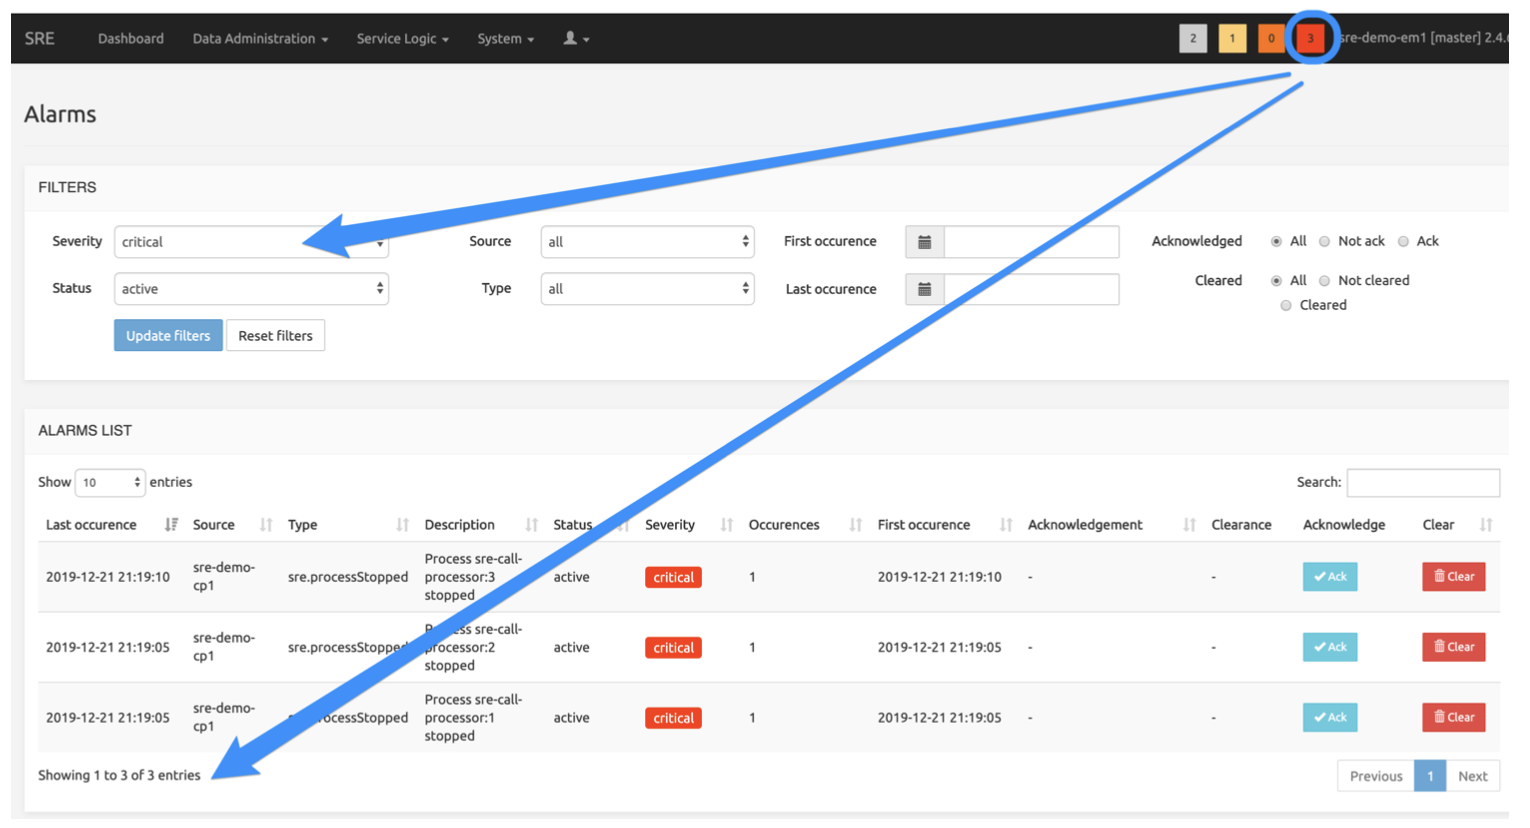
The picture below shows the Alarms page when the « critical » square (3) has been clicked. The 3 active critical alarms are listed on this page.
Alarms page
From the System menu entry in the main menu bar, selecting Alarms displays the Alarms page with default filters, retrieving all alarms recorded in the DB.
The FILTERS section allows specifying the following criteria:
Severity: all levels or any level from info to critical
Status: all statuses or a status active, user-cleared, system-cleared
Source: all nodes or any of the EM nodes and CP nodes present in the system
Type: all alarm types or any of the types. Only the types actually present in DB for the Severity filter already selected are listed, i.e. alarm types for which no alarm has been raised do not show in the list -- querying the DB on non-existing alarms is useless.
First and last occurrence: starting and ending dates for the desired time window to query.
Acknowledged: all alarms (acknowledgement ignored), or only the acknowledged ones, or only the not acknowledged ones
Cleared: all alarms (clearance ignored), or only the cleared ones, or only the not cleared ones.
INFO
Cleared alarms will be automatically deleted after a period of one year.
When all filters have been set as desired, click the Update filters button to refresh the list of alarms. Note that clicking Reset filters clears up all filters and queries the DB using default filters (all alarms, of all severities, statuses, sources and types).
The ALARM LIST section returns the alarms matching the criteria selected above. The usual Search field and navigation controls are available.
The Description field provides details about the situation that has raised an alarm.
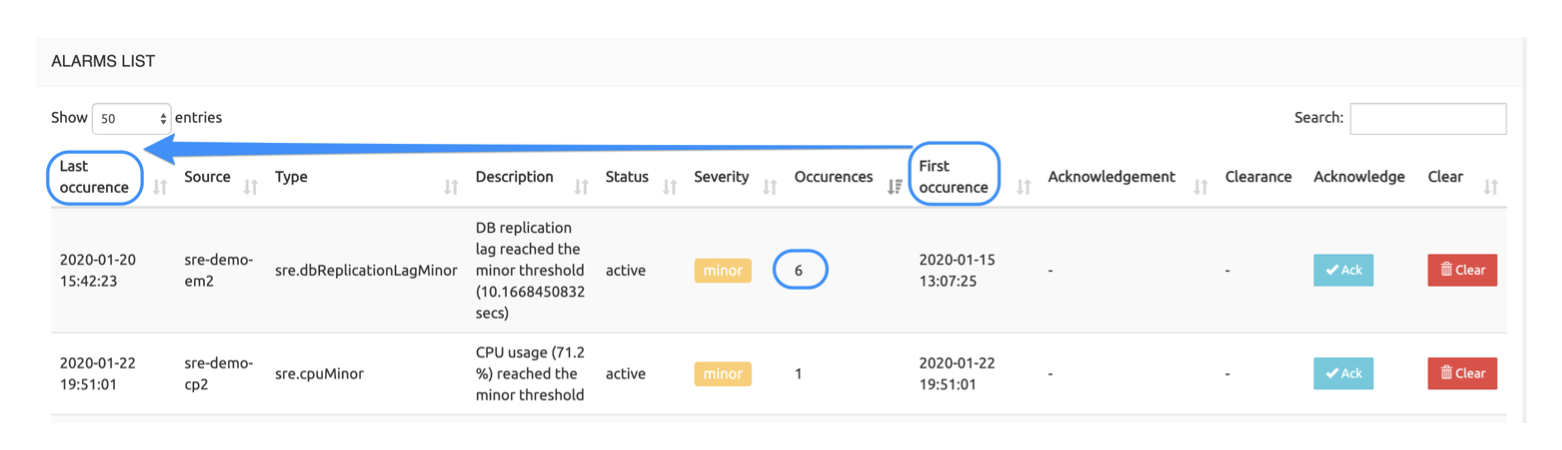
The Occurrences field marks recurrent alarms. An alarm is considered recurrent (and the number of occurrences is incremented) when a threshold is again reached for an alarm already existing in DB, for the same source with the same type and severity, in the active state (not system- or user-cleared) and the new alarm occurs after the delay set in Settings / Alarms / Alarms recurrence window (default: 60 secs).
Should the new alarm occur within the 60 secs recurrence time window, it would just be ignored (to avoid a useless increase of alarm-related data). After the 60 secs delay, a new alarm (for the same source with the same type and severity) would be created only if the state of the existing alarm(s) is not active.
The two columns Last occurrence and First occurrence show the time and date of the last and first occurrences of the alarm. If the number of occurrences is 1, they are identical. If it is > 1, the comparison of the two values gives an indication of the time elapsed between the first and last occurrence (5 days in the example below, during which the alarm occurred 6 times).
Managing Alarms
SRE alarms record situations when a threshold is reached. User management of alarms is limited to two actions through the Ack and Clear buttons on each line of the list:
Acknowledgment: clicking the Ack button changes the status from not ack to ack and stores the action's time, date and user ID. This shows other administrators that one operator has seen this alarm. This action cannot be reverted (no un-ack).
Clearance: the system automatically clears up most alarms as soon as the monitoring measurement shows that the threshold is not reached anymore. The status changes from active to system-cleared and the time and date of the clearance are stored.
Active alarms can also be cleared manually by clicking the Clear button: the status changes from active to user-cleared. The time, date and user ID are stored. This action, be it system- or user-applied, cannot be reverted (no unclear). It is not possible to delete an alarm record from the table.
SNMP Configuration
SNMP allows the network administrators of SRE to monitor the system through SNMP traps, that is, to be alerted in case an issue occurs which results in a trap notification being sent to the target OSS system.
SNMP Configuration is done in the GUI page System > Settings. SRE supports SNMP v1/2 and SNMP v3.
The Alarms tab allows adding SNMP trap receivers and setting the thresholds for various types of events. SNMPv3 trap receivers can be specified on top of standard SNMP ones. "SNMP trap receivers" are used for SNMP v1/v2, while "SNMP v3 traps receivers" are used for SNMP v3.
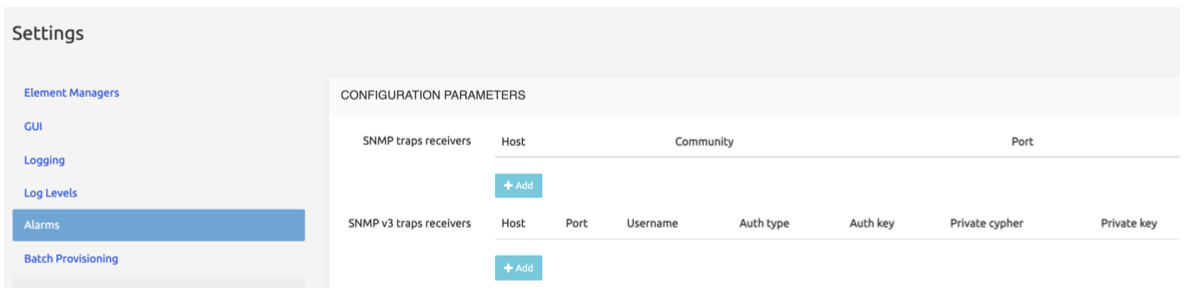
The common fields for the two types of receivers/targets are:
Host
Community (default: public)
Port (default: 162)
On SNMP v3 traps receivers the Admin also needs to specify:
Username
Auth type: MD5, SHA, SHA224, SHA256, SHA384, SHA512
Auth key
Private cipher: AES128, AES192, AES256
Private key
Email Configuration
On top of standard SNMP events, it's possible to receive emails in case an issue occurs in SRE.
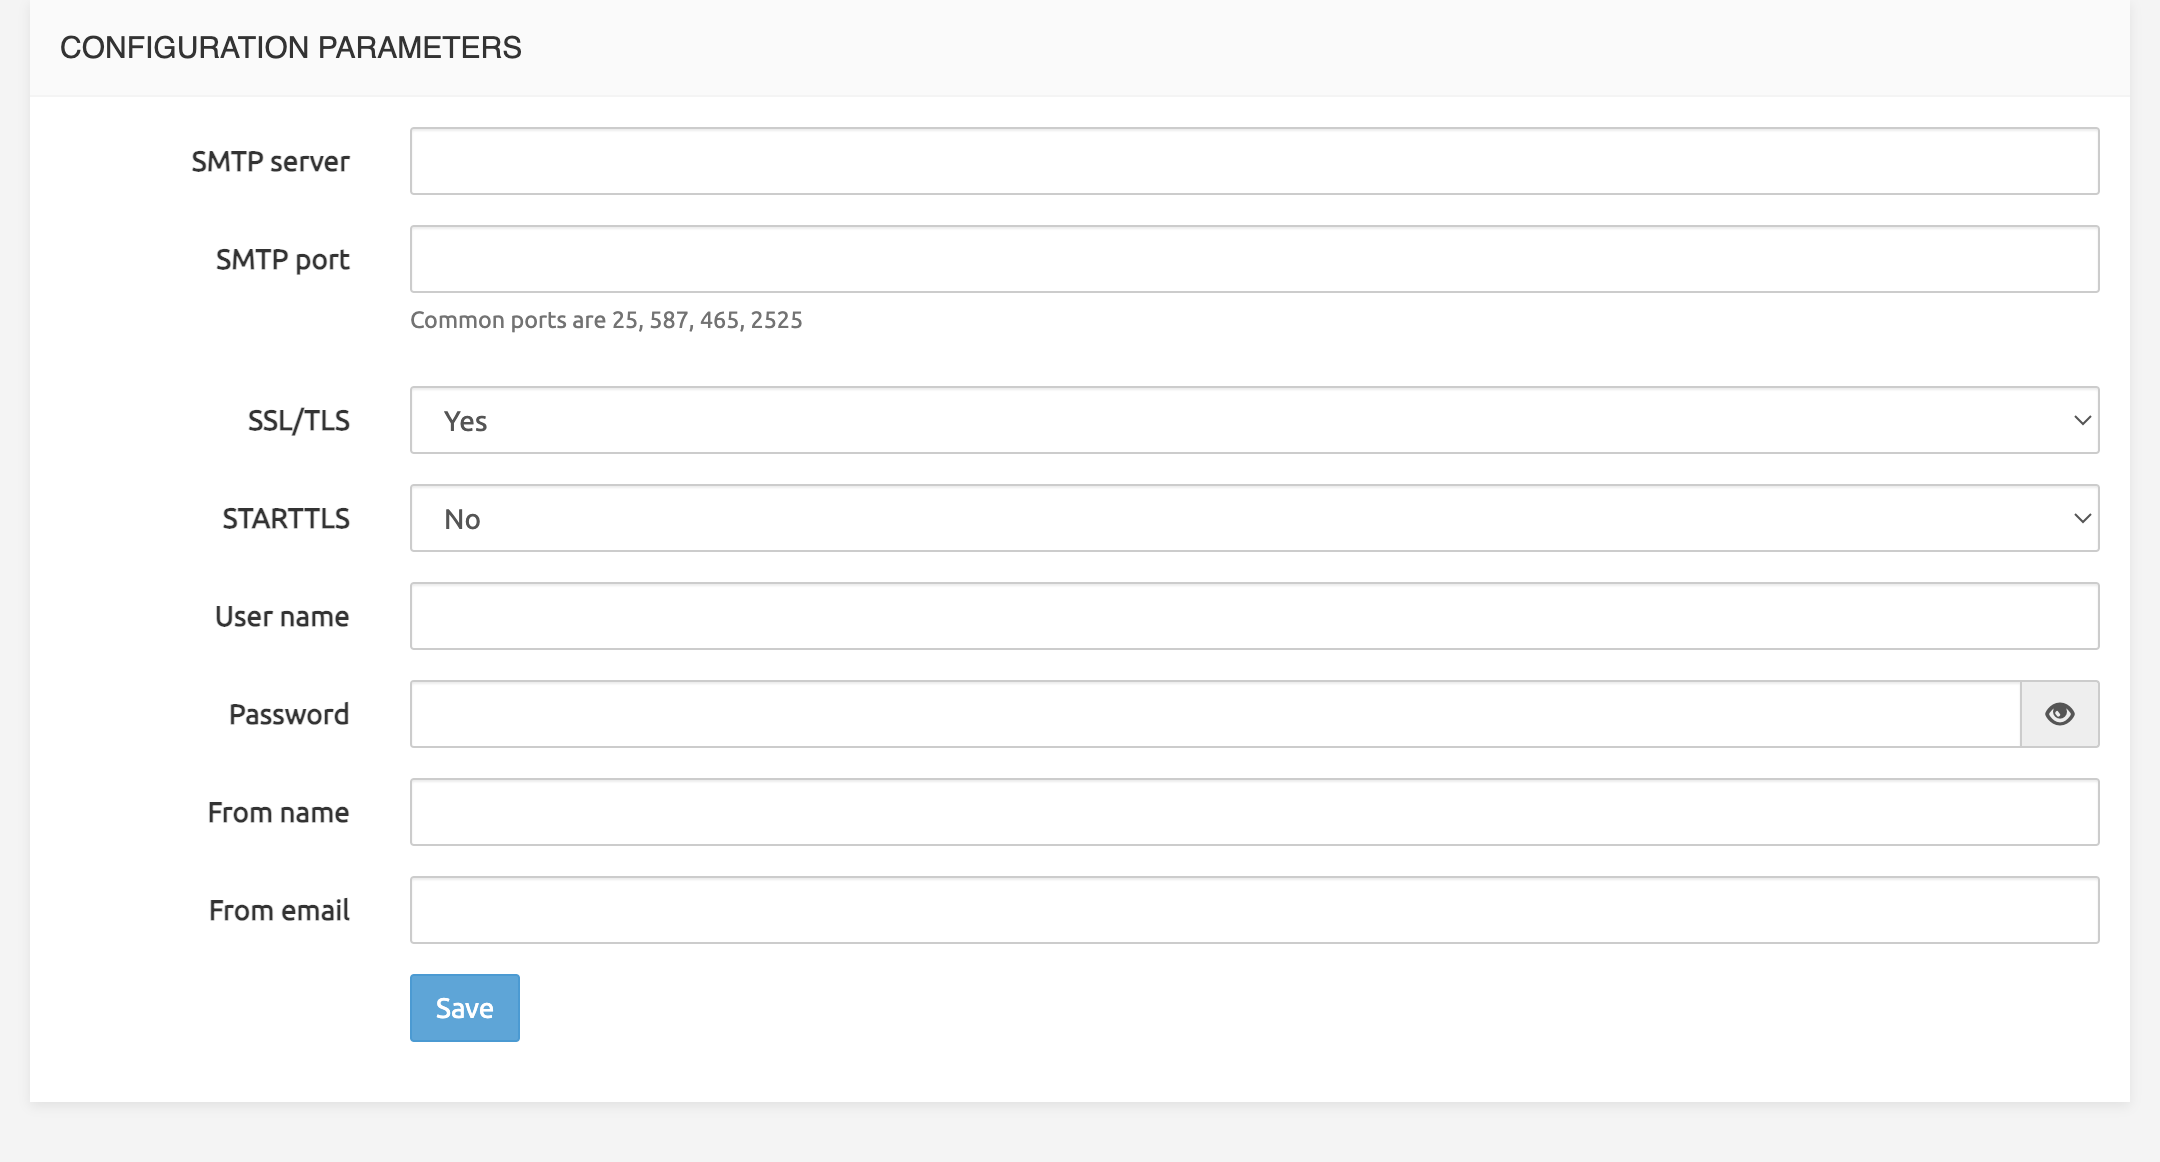
SMTP server configuration
SMTP Configuration is done in the GUI page System > Settings. The SMTP tab supports the following settings:
SMTP Server: address or hostname of relaying smtp server
SMTP Port: port of relaying smtp server
SSL/TLS: enable secure communication
START-TLS: enable encrypted communication after unencrypted handshake
Username: used for authentication with SMTP server
Password: used for authentication with SMTP server
From name
From email
Recipients configuration
Email Configuration is done in the GUI page System > Settings. The Alarms tab allows adding email addresses and setting the threshold based on alarm severity.

Alarm thresholds
For various categories, it is possible to modify the default thresholds in SRE to trigger alarms and SNMP traps. Most thresholds are defined per category and severity (minor, major, critical).
The available categories are those for which the 3 thresholds can be set:
CPU Usage
Memory usage
Disk usage (per partition)
INVITE processing performance
REGISTER processing performance
OPTIONS processing performance
ENUM NAPTR processing performance
DB replication lag
Furthermore, the following settings are available:
Alarms recurrence window (secs): alarms of the same type which fall within the defined time window are grouped together
Check interval for cdrs (mins): the time window within which it is expected that at least a cdr file is created. The default value of 0 means that this check is skipped
Kamailio shared memory usage alarm threshold
Number of days to alert before the certificate expires
Interval for checking record count increase/decrease (secs): the record count of tables will be checked every period defined by this setting
Percentage threshold for record count
Alarms description
The SRE permanently (every 4 seconds) monitors the conditions for the operations presented in the table below, and raises alarms when corresponding thresholds are reached.
Four severity levels are used:
Info: a simple information message, not linked to any threshold
Minor: raised when the minor threshold is reached. When Minor is detected, it clears Major and Critical alarms of the same type
Major: raised when the major threshold is reached. When Major is detected, it clears a Critical alarm of the same type
Critical: raised when the critical threshold is reached
The following alarms are exceptions namely by the fact that they do not get automatically cleared but require a manual action from the SRE Admin or User:
- mongoDBMemberStateChanged
- licensingPlatformLimitReached
- licensingCallProcessorLimitReached
- licensingEnumProcessorLimitReached
- licensingHttpProcessorLimitReached
- expiredCert
- recordCount
- kamailioLowMemory
- missingCDR
- Service Logic Error
- Service Logic Jump
MIBS - Traps
All traps OID have the following OID prefix: 1.3.6.1.4.1.38433.5.3.0
System
| Monitored operation | Severity | SNMP messages | Objects | Description | Trap OID suffix | system cleared? |
|---|---|---|---|---|---|---|
| CPU usage | minor | 'cpuMinor' | {node, description, severity} | Generated when CPU usage reached the minor threshold (%) | .1.11 | Y |
| CPU usage | major | 'cpuMajor' | {node, description, severity} | Generated when CPU usage reached the major threshold (%) | .1.12 | Y |
| CPU usage | critical | 'cpuCritical' | {node, description, severity} | Generated when CPU usage reached the critical threshold (%) | .1.13 | Y |
| CPU usage | info | 'cpuNormal' | {node, description, severity} | Generated when CPU usage is back to normal (< minor) | .1.13 | N/A |
| Memory usage | minor | 'memoryMinor' | {node, description, severity} | Generated when memory reached the minor threshold (%) | .1.7 | Y |
| Memory usage | major | 'memoryMajor' | {node, description, severity} | Generated when memory reached the major threshold (%) | .1.8 | Y |
| Memory usage | critical | 'memoryCritical' | {node, description, severity} | Generated when memory reached the critical threshold (%) | .1.9 | Y |
| Memory usage | info | 'memoryNormal' | {node, description, severity} | Generated when memory is back to normal (< minor) | .1.10 | N/A |
| Disks usage | minor | 'diskMinor' | {node, description, severity, mountPoint} | Generated when disk usage (on the specific mount point/partition) reached the minor threshold | .1.15 | Y |
| Disks usage | major | 'diskMajor' | {node, description, severity, mountPoint} | Generated when disk usage (on the specific mount point/partition) reached the major threshold | .1.16 | Y |
| Disks usage | critical | 'diskCritical' | {node, description, severity, mountPoint} | Generated when disk usage (on the specific mount point/partition) reached the critical threshold | .1.17 | Y |
| Disks usage | info | 'diskNormal' | {node, description, severity, mountPoint} | Generated when disk usage (on the specific mount point/partition) is back to normal (< minor) | .1.18 | N/A |
Service Logic: SIP messages processing duration (performance)
| Monitored operation | Severity | SNMP messages | Objects | Description | Trap OID suffix | system cleared? |
|---|---|---|---|---|---|---|
| INVITE Performance | minor | 'invitePerformanceMinor' | {node, description, severity} | Generated when INVITE performance reached the minor threshold (msec) | .1.19 | Y |
| INVITE Performance | major | 'invitePerformanceMajor' | {node, description, severity} | Generated when INVITE performance reached the major threshold (msec) | .1.20 | Y |
| INVITE Performance | critical | 'invitePerformanceCritical' | {node, description, severity} | Generated when INVITE performance reached the critical threshold (msec) | .1.21 | Y |
| INVITE Performance | info | 'invitePerformanceNormal' | {node, description, severity} | Generated when INVITE performance is back to normal | .1.22 | N/A |
| REGISTER Performance | minor | 'registerPerformanceMinor' | {node, description, severity} | Generated when REGISTER performance reached the minor threshold (msec) | .1.23 | Y |
| REGISTER Performance | major | 'registerPerformanceMajor' | {node, description, severity} | Generated when REGISTER performance reached the major threshold (msec) | .1.24 | Y |
| REGISTER Performance | critical | 'registerPerformanceCritical' | {node, description, severity} | Generated when REGISTER performance reached the critical threshold (msec) | .1.25 | Y |
| REGISTER Performance | info | 'registerPerformanceNormal' | {node, description, severity} | Generated when REGISTER performance is back to normal | .1.26 | N/A |
| OPTIONS Performance | minor | 'optionsPerformanceMinor' | {node, description, severity} | Generated when OPTIONS performance reached the minor threshold (msec) | .1.27 | Y |
| OPTIONS Performance | major | 'optionsPerformanceMajor' | {node, description, severity} | Generated when OPTIONS performance reached the major threshold (msec) | .1.28 | Y |
| OPTIONS Performance | critical | 'optionsPerformanceCritical' | {node, description, severity} | Generated when OPTIONS performance reached the critical threshold (msec) | .1.29 | Y |
| OPTIONS Performance | info | 'optionsPerformanceNormal' | {node, description, severity} | Generated when OPTIONS performance is back to normal | .1.30 | N/A |
| ENUM NAPTR Performance | minor | 'naptrPerformanceMinor' | {node, description, severity} | Generated when NAPTR performance reached the minor threshold (msec) | .1.71 | Y |
| ENUM NAPTR Performance | major | 'naptrPerformanceMajor' | {node, description, severity} | Generated when NAPTR performance reached the major threshold (msec) | .1.72 | Y |
| ENUM NAPTR Performance | critical | 'naptrPerformanceCritical' | {node, description, severity} | Generated when NAPTR performance reached the critical threshold (msec) | .1.73 | Y |
| ENUM NAPTR Performance | info | 'naptrPerformanceNormal' | {node, description, severity} | Generated when NAPTR performance is back to normal | .1.74 | N/A |
Service Logic: Error during node execution (no SNMP trap)
| Monitored operation | Severity | SNMP messages | Objects | Description | Trap OID suffix | system cleared? |
|---|---|---|---|---|---|---|
| Service Logic Error | info | N/A (no trap) | N/A | Error in executing the service logic | N/A | N |
| Service Logic Jump | info | N/A (no trap) | N/A | Jump to next node failed | N/A | N |
Node status
| Monitored operation | Severity | SNMP messages | Objects | Description | Trap OID suffix | system cleared? |
|---|---|---|---|---|---|---|
| node is unavailable | critical | 'nodeUnavailable' | {node, description, severity} | Generated when node is unavailable | .1.65 | Y |
| node is available | info | 'nodeAvailable' | {node, description, severity} | Generated when node is available | .1.66 | N/A |
Supervisord: process responsible for automatic launch and relaunch of processes
| Monitored operation | Severity | SNMP messages | Objects | Description | Trap OID suffix | system cleared? |
|---|---|---|---|---|---|---|
| process is stopped | critical | 'processStopped' | {node, description, severity, processName} | Generated when a process has stopped | .1.1 | Y |
| process restarted less than 5 seconds ago | info | 'processStarting' | {node, description, severity, processName, processPID} | Generated when a process is starting | .1.2 | Y |
| process start | info | 'processStarted' | {node, description, severity, processName, processPID} | Generated when a process is started | .1.3 | N/A |
Pacemaker: daemon for clustering of call processors
| Monitored operation | Severity | SNMP messages | Objects | Description | Trap OID suffix | system cleared? |
|---|---|---|---|---|---|---|
| pacemaker node is down | critical | 'pacemakerNodeDown' | {node, description, severity, pacemakerHost} | Generated when pacemaker node is down | .1.54 | Y |
| pacemaker node is up | info | 'pacemakerNodeUp' | {node, description, severity, pacemakerHost} | Generated when pacemaker node is up | .1.55 | N/A |
| pacemaker node is locked | info | 'pacemakerNodeLocked' | {node, description, severity, pacemakerHost} | Generated when pacemaker node is locked | .1.56 | Y |
| pacemaker quorum is lost | critical | 'pacemakerQuorumLost' | {node, description, severity} | Generated when pacemaker quorum is lost | .1.57 | Y |
| pacemaker quorum reached | info | 'pacemakerQuorumReached' | {node, description, severity} | Generated when pacemaker quorum is reached | .1.58 | N/A |
| pacemaker resource is down | critical | 'pacemakerResourceDown' | {node, description, severity, pacemakerResource} | Generated when pacemaker resource is down | .1.59 | Y |
| pacemaker resource is up | info | 'pacemakerResourceUp' | {node, description, severity, pacemakerResource} | Generated when pacemaker resource is up | .1.60 | N/A |
| pacemaker resource is locked | info | 'pacemakerResourceLocked' | {node, description, severity, pacemakerResource} | Generated when pacemaker resource is locked | .1.61 | Y |
CDR Collector availability
| Monitored operation | Severity | SNMP messages | Objects | Description | Trap OID suffix | system cleared? |
|---|---|---|---|---|---|---|
| cdr collector is unreachable | major | 'cdrCollectorDown' | {node, description, severity, collectorHost} | Generated when CDR is down | .1.50 | Y |
| cdr collector is reachable | major | 'cdrCollectorUp' | {node, description, severity, collectorHost} | Generated when CDR is up | .1.51 | N/A |
SIP Agents
| Monitored operation | Severity | SNMP messages | Objects | Description | Trap OID suffix | system cleared? |
|---|---|---|---|---|---|---|
| agentDown | info | 'sipAgentDown' | {node, description, severity, agentName, agentAddress, agentPort, agentTransport} | Generated when a SIP agent is unreachable | .1.4 | Y |
| agentTrying | info | 'sipAgentTrying' | {node, description, severity, agentName, agentAddress, agentPort, agentTransport} | Generated when a SIP agent status is still unknown | .1.5 | Y |
| agentUp | info | 'sipAgentUp' | {node, description, severity, agentName, agentAddress, agentPort, agentTransport} | Generated when a SIP agent is reachable | .1.6 | N/A |
Postgres DB Replication
| Monitored operation | Severity | SNMP messages | Objects | Description | Trap OID suffix | system cleared? |
|---|---|---|---|---|---|---|
| disconnected | critical | 'replicationNodeDBDisconnected' | {node, description, severity, standbyNode} | Generated when a node DB disconnected from replication | .1.31 | |
| connected | info | 'replicationNodeDBConnected' | {node, description, severity, standbyNode} | Generated when a node DB connected for replication | .1.32 | |
| Lag (between write on master and write on slave) | minor | 'replicationLagMinor' | {node, description, severity} | Generated when replication lag reached the minor threshold (sec.) | .1.33 | |
| Lag (between write on master and write on slave) | major | 'replicationLagMajor' | {node, description, severity} | Generated when replication lag reached the major threshold (sec.) | .1.34 | |
| Lag (between write on master and write on slave) | critical | 'replicationLagCritical' | {node, description, severity} | Generated when replication lag reached the critical threshold (sec.) | .1.35 | |
| Lag (between write on master and write on slave) | critical | 'replicationLagNormal' | {node, description, severity} | Generated when replication lag is back to normal (< minor) | .1.36 |
MongoDB
| Monitored operation | Severity | SNMP messages | Objects | Description | Trap OID suffix | system cleared? |
|---|---|---|---|---|---|---|
| MongoDB down | critical | 'localMongoDBDown' | {node, description, severity} | Generated when connection to MongoDB on localhost fails | .1.38 | Y |
| MongoDB up | info | 'localMongoDBUp' | {node, description, severity} | Generated when connection to MongoDB on localhost is successful | .1.37 | N/A |
| No primary | critical | 'mongoDBNoPrimary' | {node, description, severity} | Generated when no primary is active in the MongoDB replicaset | .1.39 | Y |
| Primary is present | info | 'mongoDBPrimary' | {node, description, severity, mongoDBMember} | Generated when a primary is active in the MongoDB replicaset | .1.40 | N/A |
| Node state change | major | 'mongoDBMemberStateChanged' | {node, description, severity, mongoDBMember} | Generated when the state of a MongoDB replicaset member changes | .1.41 | N |
InfluxDb
| Monitored operation | Severity | SNMP messages | Objects | Description | Trap OID suffix | system cleared? |
|---|---|---|---|---|---|---|
| InfluxDb instance is down | minor | 'influxDBUnavailable' | {node, description, severity, influxdbHostname} | Generated when influxdb is unavailable | .1.62 | Y |
| InfluxDb instance is up | info | 'influxDBAvailable' | {node, description, severity, influxdbHostname} | Generated when influxdb is available | .1.63 | N/A |
Licensing
| Monitored operation | Severity | SNMP messages | Objects | Description | Trap OID suffix | system cleared? |
|---|---|---|---|---|---|---|
| System-wide SIP License Limit Reached | major | 'licensingPlatformLimitReached' | {node, description, severity} | Generated when the limit of system-wide CAPS (SIP interface) is reached as an average in at least a burst window (10 sec.) | .1.42 | N |
| SIP Call Processor Limit | major | 'licensingCallProcessorLimitReached' | {node, description, severity} | Generated when calls count reached the call processor hard limit during the last burst window | .1.43 | N |
| HTTP Processor Limit | major | 'licensingHttpProcessorLimitReached' | {node, description, severity} | Generated when request count reached the HTTP processor hard limit during the last burst window | .1.45 | N |
| ENUM Processor Limit | major | 'licensingEnumProcessorLimitReached' | {node, description, severity} | Generated when ENUM request count reached the ENUM processor hard limit during the last burst window | .1.46 | N |
Custom Alarms
| Monitored operation | Severity | SNMP messages | Objects | Description | Trap OID suffix |
|---|---|---|---|---|---|
| customAlarm | configurable by node | 'customAlarm' | {node, description, severity, customAlarmType, customAlarmDescription} | Custom alarm generated by service logic node | .1.44 |
| customAlarmClear | info | 'customAlarmClear' | {node, description, severity, customAlarmType} | Custom alarm cleared by service logic node. For an alarm to be cleared, the customAlarmType of the clearing must match that of the customAlarm | .1.47 |
CDR
| Monitored operation | Severity | SNMP messages | Objects | Description | Trap OID suffix | system cleared? |
|---|---|---|---|---|---|---|
| Missing CDR | critical | 'missingCDR' | {node, description, severity} | Generated when no CDR is produced during an interval specified in System Settings | .1.48 | N |
Kamailio
| Monitored operation | Severity | SNMP messages | Objects | Description | Trap OID suffix | system cleared? |
|---|---|---|---|---|---|---|
| Kamailio Low Memory | major | 'kamailioLowMemory' | {node, description, severity} | Generated when kamailio memory usage reaches the threshold | .1.49 | N |
Certificate
| Monitored operation | Severity | SNMP messages | Objects | Description | Trap OID suffix | system cleared? |
|---|---|---|---|---|---|---|
| Certificate expiration | major | 'expiredCert' | {node, description, severity, certificate} | Generated when a certificate is about to expire | .1.52 | N |
DB changes
| Monitored operation | Severity | SNMP messages | Objects | Description | Trap OID suffix | system cleared? |
|---|---|---|---|---|---|---|
| DB record count | major | 'recordCount' | {node, description, severity, datamodel, table, oldCount, newCount} | Generated when record count increases or decreases above threshold | .1.53 | N |
DB Cluster
| Monitored operation | Severity | SNMP messages | Objects | Description | Trap OID suffix | system cleared? |
|---|---|---|---|---|---|---|
| repmgr daemon is down | major | 'repmgrUnavailable' | {node, description, severity} | Generated when repmgr is unavailable | .1.67 | Y |
| repmgr daemon is up | info | 'repmgrAvailable' | {node, description, severity} | Generated when repmgr is available | .1.68 | N/A |
| database switchover | critical | 'dbSwitchover' | {node, description, severity, newMaster} | Generated when database switchover happens | .1.69 | N |
Remote registrations
| Monitored operation | Severity | SNMP messages | Objects | Description | Trap OID suffix | system cleared? |
|---|---|---|---|---|---|---|
| remote registration failed | major | 'registrationFailed' | {node, description, severity, registrationId} | Generated when remote registration fails | .1.75 | Y |
| remote registration ok | info | 'registrationOk' | {node, description, severity, registrationId} | Generated when remote registration is successful | .1.76 | N/A |
Db connections
| Monitored operation | Severity | SNMP messages | Objects | Description | Trap OID suffix | system cleared? |
|---|---|---|---|---|---|---|
| DB connections over critical threshold | critical | 'dbConnections' | {node, description, severity} | Generated when db connections reach the critical threshold | .1.86 | Y |
Media
| Monitored operation | Severity | SNMP messages | Objects | Description | Trap OID suffix | system cleared? |
|---|---|---|---|---|---|---|
| media server restarted | major | 'mediaServerRestarted' | {node, description, severity, contact} | Generated when media server has restarted | .1.87 | Y |
| media server started | info | 'mediaServerStarted' | {node, description, severity, contact} | Generated when media server has started | .1.78 | N/A |
| Media Processor Limit | major | 'licensingMediaProcessorLimitReached' | {node, description, severity} | Generated when media calls count reached the media processor licensing limit during the last burst window | .1.89 | N |
| Media Platform Limit | major | 'licensingMediaPlatformLimitReached' | {node, description, severity} | Generated when media calls count reached the global platform licensing limit | .1.90 | N |
MIBS - Objects
| Object Name | Syntax | OID .1.3.6.1.4.1.38433.5 + |
|---|---|---|
| node | DisplayString | .2.1 |
| description | DisplayString | .2.2 |
| severity | INTEGER { info ( 0 ) ,warning ( 10 ) , minor( 20 ) , major ( 30 ) ,critical ( 40 ) } | .2.3 |
| processName | DisplayString | .2.4 |
| processPID | Integer32 | .2.5 |
| agentName | DisplayString | .2.6 |
| agentAddress | IpAddress | .2.7 |
| agentPort | Integer32 | .2.8 |
| agentTransport | INTEGER { udp ( 0 ) ,tcp ( 1 ) } | .2.9 |
| standbyNode | DisplayString | .2.10 |
| mountPoint | DisplayString | .2.11 |
| mongoDBMember | DisplayString | .2.12 |
| customAlarmType | DisplayString | .2.13 |
| customAlarmDescription | DisplayString | .2.14 |
| startInterval | DisplayString | .2.15 |
| endInterval | DisplayString | .2.16 |
| collectorHost | DisplayString | .2.17 |
| certificate | DisplayString | .2.18 |
| datamodel | DisplayString | .2.19 |
| table | DisplayString | .2.20 |
| oldCount | DisplayString | .2.21 |
| newCount | DisplayString | .2.22 |
| pacemakerHost | DisplayString | .2.23 |
| pacemakerResource | DisplayString | .2.24 |
| influxdbHostname | DisplayString | .2.25 |
| newMaster | DisplayString | .2.26 |
| registrationId | DisplayString | .2.27 |
| contact | DisplayString | .2.28 |
High-level actions upon alarm generation
The following table lists possible actions to execute, upon receiving one or more application alarms described in this document. It is understood that the described operations will require technical knowledge of the SRE system, as well as further documentation such as the Operations&Monitor document.
| Alarm | Description | Troubleshooting action | OaM guide |
|---|---|---|---|
| CPU Usage | The CPU on a virtual machine is on high consumption | Verify with the command "top" what is the process, or list of processes, that are most consuming the CPU resources. If in abnormal consumption, you can restart the process and check it does not end up in the same situation. | Section 3.3 for monitoring the CPU usage. Section 1/2 for restarting the SRE processes/services |
| Memory Usage | The available memory on a virtual machine is on high consumption | Verify with the commands "top" and "free" what is the memory situation and the process, or list of processes, that are most consuming memory. If in abnormal consumption, you can restart the process and check it does not end up in the same situation. | Section 3.3 for monitoring the memory usage. Section 1/2 for restarting the SRE processes |
| Disks Usage | A partition in the file system is occupied over the thresholds | In most cases, /var/log gets filled up due to high traffic and log-levels producing too many log lines for the automatic log rotation. In such a case, you can safely remove the logs which occupy the most, making sure you don't delete the currently open log file (e.g. sre.log) but only those of past days (e.g. sre.log.2023-05-02). For different partitions, you'll need to verify with standard linux commands which directory within the partition is taking more disk space and take action accordingly. Particular attention must be given to database directories (/var/lib/pgsql and /data /sre/location), since they cannot get freed without risks by a manual deletion of files. | Section 3.1 and 3.2 |
| INVITE Performance | The performance of processing INVITE as an average over the observation period (5 minutes) is beyond the acceptable thresholds | An analysis of the service logic execution must be carried out from debug logs (t racing.summary) in order to understand if this behavior is caused by a subset of calls, if it only happens on a specific CP node, or if it's instead generalized over all calls. Statistics in "stats counter" tab can also be checked. Especially the section displaying the stats performance per SL node in order to pinpoint if a specific node takes a long time. CPU usage can be also checked. | Section 3.2 for monitoring the CPU usage. Section 1/2 for restarting the SRE processes |
| Process Stopped | A process which was previously started has stopped | In the first place it must be checked whether the process is relevant for the type of node (EM vs CP) and for the specific SRE deployment.\ If the process should be effectively running, you need to check the SRE logs related to the process to understand the root cause, and restart the process through supervisorctl commands | Section 3.4.1 to know the relevant processes for the type of node. Section 4.2 for checking the logs. Section 1 for process restart |
| Agent down | A SIP Agent (sip peer of SRE) is replying with a rejection to SIP OPTIONS sent by an SRE CP | An analysis on the target sip peer must be carried out. Use sngrep tool on the SRE to confirm that no answer is received for the SIP OPTIONS. | Section 11 related to sngrep tool |
| Agent trying | An SRE CP is not receiving anymore a response to SIP OPTIONS sent to a specific SIP Agent | Verify with the help of sngrep, tcpdump or a monitoring tool that effectively no answers are received at the CP level upon SIP OPTIONS. The possible cause might reside in the underlying network (routing, firewalls, ...) | Section 10 related to sngrep tool |
| Postgres DB Disconnected | A node (EM master or EM standby / CP) has the local instance of Postgres DB unavailable | Verify the service "postgresql-14" (running / inactive), the Postgres logs, and the disk space on the partitions / and /data. If the problem is disk space the service will not be able to restart, so it must be freed upfront. | Section 3.1 for file system monitoring Section 3.5 for postgres monitoring. |
| Postgres DB Replication Lag | The replication of the database on a standby node has taken longer than the thresholds | If it only happens a few times and it doesn't occur again, it's a temporary condition due to the underlying network, therefore no action is required. If instead it's a permanent issue that keeps occurring, it must be investigated in terms of round trip delay between the standby node and the master node (ping from the standby to the master), as well as the availability of all Postgres WALS files ( /data/sre/wals) on the standby node as in the master | |
| MongoDB down | A specific node (e.g. CP) has its local instance of MongoDB stopped, whereas it should be running. This doesn't affect Call Admission Control as long as a PRIMARY is available. | Check the mongo logs ( /var/log/mongo) to understand the condition that led to a stop. It is possible that disk space is causing the issue. Try to restart the service mongod and check the startup process through systemctl and journalctl if it doesn't start again. Also, verify on other nodes that mongo is running and that a PRIMARY node is available. | Mongo status: section 3.7.1 Mongo restart: . section 2.4 |
| MongoDB No Primary Node | There is no elected PRIMARY node of MongoDB. This happens when at least half of the Mongo instances are stopped. | Verify MongoDB status on the unavailable nodes. Try to restart the service mongod or check systemctl and journalctl in case it doesn't start again. In order to have a PRIMARY node back, you'll need to restore at least half + 1 mongoDB nodes. | Mongo Replica set status: section 3.7.2 Mongo restart:section 2.4 |
| MongoDB Node State Changed | A node that used to be PRIMARY has changed its state to SECONDARY | Typically there is no urgent action related to this. Check mongoDB logs and verify that the cluster has elected a new PRIMARY. | Mongo status: section 3.7.1 |
| Missing CDR | The accounting master did not produce CDR files in the time frame configured in the Settings | Verify that the process sr e-cdr-collector is running. If so, check that sre-cdr-sender is running on CP nodes. Verify the sre-cdr-sender logs on master EM, then verify that CP nodes are producing events | Process status: section 1 Logs: section 3.2 |
| CDR collector is down | cdr-sender process on CP could not connect to cdr-collector process running on EM. | Verify that the process sr e-cdr-collector is running. If so, check that sre-cdr-sender is running on CP nodes. Verify connectivity between CP and EM on port 10002 with tcpdump. | Process status: section 1 Logs: section 3.2 |